ETF/No Load Fund Tracker StatSheet
————————————————————-
THE LINK TO OUR CURRENT ETF/MUTUAL FUND STATSHEET IS:
————————————————————
Market Commentary
Friday, March 21, 2014
EQUITY INDEXES LOSE STEAM BUT GAIN FOR THE WEEK
1. Moving The Markets
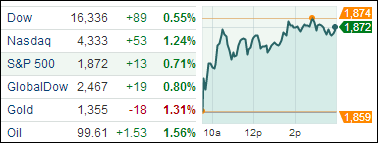
Equities were bouncing back this week but metals aren’t keeping up. More important is Janet Yellen’s statement indicating that interest rates could rise sooner than expected. The unemployment rate, though manipulated, is still higher than what the FED would regard as ‘full employment.’
The big news item for the week was Wednesday’s announcement by newly appointed Federal Reserve chair Janet Yellen indicating that interest rates could go up sooner than previously expected. While Wall Street had been anticipating the Fed to raise rates for quite some time, the ambiguous manner in which Yellen addressed the issue sent stocks and bonds tumbling. Adding to the vagueness were other mitigating factors that could play into the Fed’s decision making process, namely the unemployment rate which currently stands at 6.7 percent, well above the 5.2 to 5.6 percent range Fed officials see as in keeping with full employment.
Domestic markets aren’t quite in the same Q1 stride as we experienced in 2013. In the first quarter 2013, advancing days exceeded declining days by nearly 61%. For 2014, that ratio is down to 16%, and with only 7 more sessions remaining for the current quarter, there’s not much room for improvement. That means it’s important to have your sell stop discipline in place in case momentum goes the other way, and the markets decide to head south.
Geopolitical issues remained in focus this week after President Vladimir V. Putin signed laws completing Russia’s annexation of Crimea and investors were unnerved by a decision by the United States to slap sanctions on his inner circle. Russia’s MICEX stock index was down 1 percent.
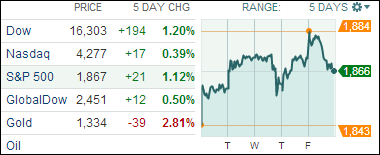
Gold and the rest of the precious metals complex has been taking some hard hits this week, scaring off would-be investors from diverting capital into the traditional safe-haven asset. While the yellow metal is down below a key support level of $1,350, it is also up 9% for the quarter, a performance that is 6-times that of the aforementioned large-cap equities sector.
Our 10 ETFs in the Spotlight edged higher with 1 of them making a new high today while 7 of them are remaining on the plus side YTD.