ETF/No Load Fund Tracker Newsletter For March 28, 2014
ETF/No Load Fund Tracker StatSheet
————————————————————-
THE LINK TO OUR CURRENT ETF/MUTUAL FUND STATSHEET IS:
https://theetfbully.com/2014/03/weekly-statsheet-for-the-etfno-load-fund-tracker-newsletter-updated-through-03272014/
————————————————————
Market Commentary
Friday, March 28, 2014
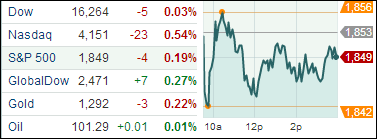
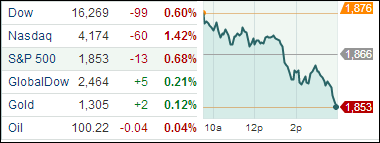
A CHOPPY WEEK FOR THE U.S.; BUT SIDEWAYS IS BETTER THAN DOWN
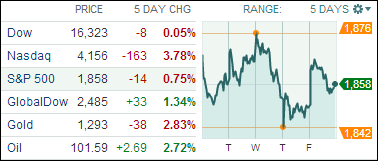
[Chart courtesy of MarketWatch.com]
1. Moving The Markets
Global stock markets moved in different directions this week, with major indices in Europe and Asia gaining broadly, while US stocks bounced around. The technology-heavy Nasdaq Composite Index came under pressure from profit taking in high-flying biotechnology and new-generation technology stocks. The S&P 500 finished slightly lower for the week. With one trading day left in March, stocks are up 0.5% on the year and will be aiming for a fifth consecutive quarter of gains.
Broadly, the outlook for the domestic and global economy remains favorable amongst Wall Street analysts, as many developed economies, including the U.S. and Europe, are poised for hopefully improving growth this year, helping offset the slowdown in some emerging markets. Revisions to real gross domestic product showed the economy rose at a 2.6% annual rate in the fourth quarter, slightly faster than the previous estimate. The upward revision was primary a result of stronger personal spending, which leads us to look at consumer confidence, which rose in March to its highest level since January 2008.
In corporate news this week, we received word that Lehman Brothers will pay out another $17.9 billion to creditors, bringing its total payout to date to about $80.4 billion since leaving Chapter 11 bankruptcy on 6 March 2012. King Digital Entertainment (KING), the maker of the popular mobile video game Candy Crush Saga, had the worst performing initial public offering this year. The stock fell close to 16% in its first day, and slid further the next day. The big concern is that the company could be a one-hit wonder that has already seen its best days. The failed IPO is once again an indication as to how tricky IPO valuations can be.
Our 10 ETFs in the Spotlight vacillated with the indexes with 2 of them making a new high today; 7 of them are remaining on the plus side YTD. Please note that I have adjusted the “Basis” and the “High” price, used to calculate our trailing sell stops, for the dividends paid in the first quarter. See the YTD table below for details.
2. ETFs in the Spotlight
In case you missed the announcement and description of this section, you can read it here again.
It features 10 broadly diversified ETFs from my HighVolume list as posted every Monday. Furthermore, they are screened for the lowest MaxDD% number meaning they have been showing better resistance to temporary sell offs than all others over the past year.
In other words, none of them ever triggered their 7.5% sell stop level during this time period, which included a variety of severe market pullbacks but no move into outright bear market territory.
Here are the 10 candidates:
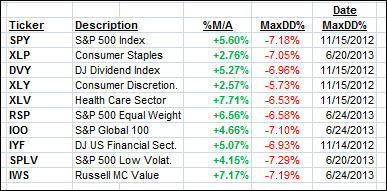
All of them are in “buy” mode meaning their prices are above their respective long term trend lines by the percentage indicated (%M/A).
Year to date, here’s how the above candidates have fared so far:
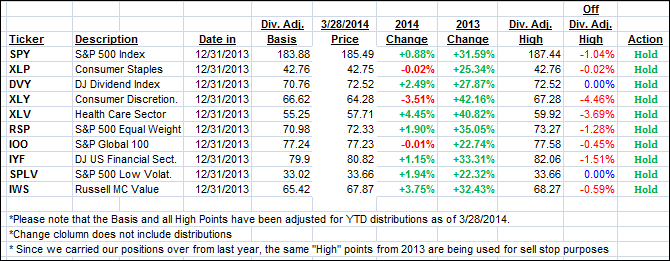
To be clear, the first table above shows the position of the various ETFs in relation to their respective long term trend lines (%M/A), while the second one tracks their trailing sell stops in the “Off High” column.
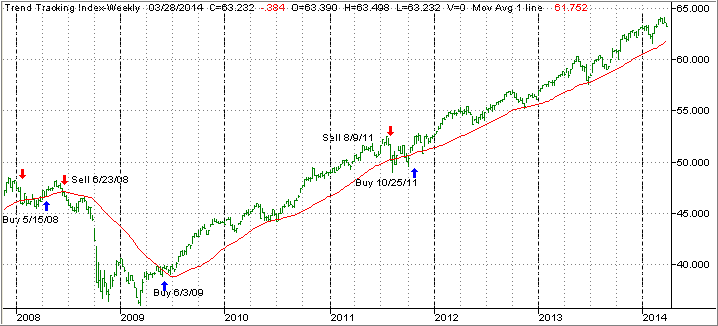
3. Domestic Trend Tracking Indexes (TTIs)
Our Trend Tracking Indexes (TTIs) showed a mixed picture again and ended the week as follows:
Domestic TTI: +2.48% (last Friday +3.24%)
International TTI: +3.37% (last Friday +2.96%)
Have a great week.
Ulli…
Disclosure: I am obliged to inform you that I, as well as advisory clients of mine, own some of these listed ETFs. Furthermore, they do not represent a specific investment recommendation for you, they merely show which ETFs from the universe I track are falling within the guidelines specified.
————————————————————-
READER Q & A FOR THE WEEK
All Reader Q & A’s are listed at our web site!
Check it out at:
http://www.successful-investment.com/q&a.php
A note from reader Ken:
Q: Ulli: I follow you via Twitter and noticed that you publish Friday’s newsletter edition around 4 pm PST. About an hour later you publish an update, but I can’t seem to figure out what has been updated. Could you explain?
A: Ken: Sure, when I publish the newsletter, I don’t have all weekending values available by 4 pm. The update I post later in the day makes a correction to the Trend Tracking Indexes (TTIs) when the weekly moving averages are being adjusted. These data points become available later on, hence the update.
———————————————————-
WOULD YOU LIKE TO HAVE YOUR INVESTMENTS PROFESSIONALLY MANAGED?
Do you have the time to follow our investment plans yourself? If you are a busy professional who would like to have his portfolio managed using our methodology, please contact me directly or get more details at:
https://theetfbully.com/personal-investment-management/
———————————————————
Back issues of the ETF/No Load Fund Tracker are available on the web at:
https://theetfbully.com/newsletter-archives/

 The unwinding of the Federal Reserve’s bond purchase program, and the gradual improvement of the US labor market, will result in a hike in interest rates, possibly by the spring of 2015 as mentioned by Fed chairwoman Janet Yellen after the last FOMC meet.