ETF/No Load Fund Tracker Newsletter For April 18, 2014
ETF/No Load Fund Tracker StatSheet
————————————————————-
THE LINK TO OUR CURRENT ETF/MUTUAL FUND STATSHEET IS:
————————————————————
Market Commentary
Friday, April 18, 2014
AFTER A SLOW START, INDEXES PICK UP MOMENTUM
1. Moving The Markets
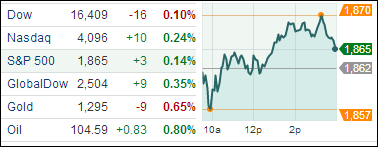
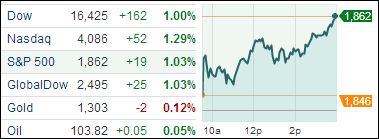
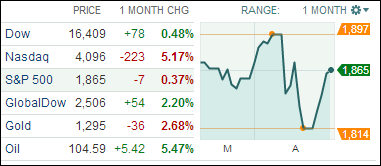
During this Holiday shortened week, the major indexes managed a strong comeback with the S&P 500 gaining 2.7%, which was its best showing since July last year; this puts us only 7 points away from where we started the month.
The 30-day chart above shows that it’s been a roller coaster ride with the S&P at one point threatening to break above the 1,900 milestone only to succumb to severe selling pressures, but the bulls were finally able to gain the upper hand again over the past 4 trading days.
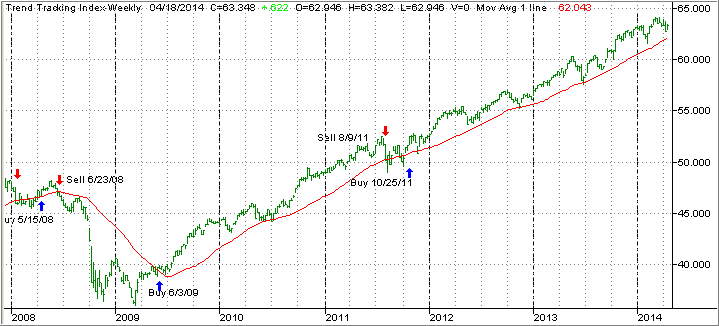
The major trends in the market place, as measured by our Trend Tracking Indexes (TTIs), remain intact as you can see in section 3 below.
As I pointed out yesterday, our 10 ETFs in the Spotlight went sideways with one of them still remaining below its long term trend line; however, 1 made a new high today while 9 are now in the green YTD.
2. ETFs in the Spotlight
In case you missed the announcement and description of this section, you can read it here again.
It features 10 broadly diversified ETFs from my HighVolume list as posted every Monday. Furthermore, they are screened for the lowest MaxDD% number meaning they have been showing better resistance to temporary sell offs than all others over the past year.
In other words, none of them ever triggered their 7.5% sell stop level during this time period, which included a variety of severe market pullbacks but no move into outright bear market territory.
Here are the 10 candidates:
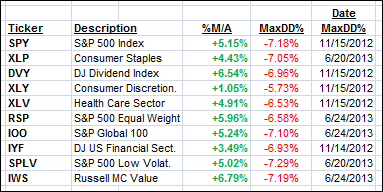
All of them are in “buy” mode, with the exception of XLY, meaning their prices are above their respective long term trend lines by the percentage indicated (%M/A).
Year to date, here’s how the above candidates have fared so far:
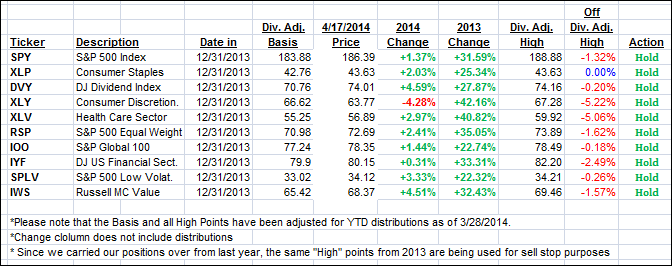
To be clear, the first table above shows the position of the various ETFs in relation to their respective long term trend lines (%M/A), while the second one tracks their trailing sell stops in the “Off High” column. The “Action” column will signal a “Sell” once the -7.5% point is taken out in the “Off High” column.
3. Domestic Trend Tracking Indexes (TTIs)
Our Trend Tracking Indexes (TTIs) recovered from last Friday and closed higher:
Domestic TTI: +2.26% (last Friday +1.17%)
International TTI: +3.20% (last Friday +1.80%)
Have a great Easter weekend.
Ulli…
Disclosure: I am obliged to inform you that I, as well as advisory clients of mine, own some of these listed ETFs. Furthermore, they do not represent a specific investment recommendation for you, they merely show which ETFs from the universe I track are falling within the guidelines specified.
————————————————————-
READER Q & A FOR THE WEEK
All Reader Q & A’s are listed at our web site!
Check it out at:
http://www.successful-investment.com/q&a.php
A note from reader Tom:
Q: Ulli: I’m a fan of low-cost Vanguard ETFs. Which ones would be equivalent to the 10 you track? Do the 10 you track have better performance or liquidity to justify paying a higher fee?
A: Tom: I don’t know which ones are the equivalents; you will have to do that work yourself. The 10 I have listed were selected based on the criteria I mentioned. The fees with these high volume ETFs are very low to begin with, so I don’t concern myself with whether Vanguard ETFs are a fraction lower or not. My idea is to use a sound methodology and not try to pick up nickels and dimes…
Also, you should look not only at fees but also the bid/ask spread, which is where you really can pay more in illiquid ETFs. SPY, for example, is the largest and most liquid ETF in the universe, and I doubt the Vanguard equivalent can come close to this liquidity and low bid/ask spread.
———————————————————-
WOULD YOU LIKE TO HAVE YOUR INVESTMENTS PROFESSIONALLY MANAGED?
Do you have the time to follow our investment plans yourself? If you are a busy professional who would like to have his portfolio managed using our methodology, please contact me directly or get more details at:
https://theetfbully.com/personal-investment-management/
———————————————————
Back issues of the ETF/No Load Fund Tracker are available on the web at: