
1. Moving The Markets
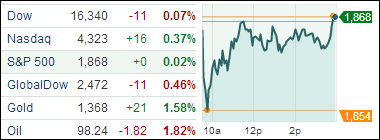
For much of trading today, the U.S. stock market appeared to be headed for its third decline in three days. By late afternoon though, the indexes began to slowly recover its losses as investors bought up oil refiners, mining companies and tech stocks. Afternoon activity was just enough to nudge the S&P 500 and Nasdaq into positive territory to close out the day. Six of the 10 industry sectors in the S&P 500 index notched small declines, with industrials posting the biggest drop. Utilities paced other gainers, as investors moved money into the relatively low-risk sector. The three major indexes are still down for the week, after a record setting performance the week before.
The news that we received over the weekend that China’s exports dropped substantially in February has raised investor’s eyebrows to say the least. Commodities such as copper and iron ore have dropped substantially over the past couple of days, with copper near its lowest level since 2010. Occasional weak data news coming out of China is nothing new; however, the thing to remember is that markets are at an all-time high and are thus much more sensitive to any kind of negative news.
Bad news from China did not stop investors from making heavy investments in oil refiners today. Leading the S&P 500 was Tesoro Corp. (TSO), posting gains of 4.07%. Valero Energy Corp (VLO) also posted notable gains of 3%.
Investors await the next round of market moving news that will come out on Thursday, when new data on retail sales and weekly unemployment benefit applications are released. On Friday, a survey of consumer confidence should give traders a better sense of how Americans feel about the economy.
Our 10 ETFs in the Spotlight went pretty much sideways with none of them making new highs today but 7 of them currently showing gains YTD.
2. ETFs in the Spotlight
In case you missed the announcement and description of this section, you can read it here again.
It features 10 broadly diversified ETFs from my HighVolume list as posted every Monday. Furthermore, they are screened for the lowest MaxDD% number meaning they have been showing better resistance to temporary sell offs than all others over the past year.
In other words, none of them ever triggered their 7.5% sell stop level during this time period, which included a variety of severe market pullbacks but no move into outright bear market territory.
Here are the 10 candidates:
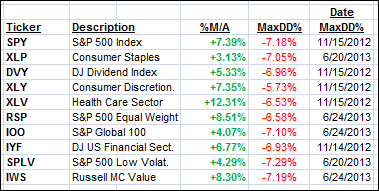
All of them are in “buy” mode meaning their prices are above their respective long term trend lines by the percentage indicated (%M/A).
Year to date, here’s how the above candidates have fared so far:
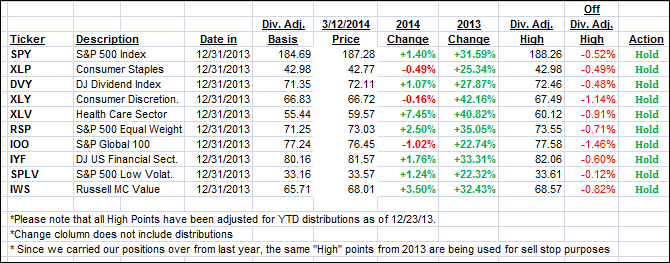
To be clear, the first table above shows the position of the various ETFs in relation to their respective long term trend lines (%M/A), while the second one tracks their trailing sell stops in the “Off High” column.
3. Domestic Trend Tracking Indexes (TTIs)
Our Trend Tracking Indexes (TTIs) were mixed today as the Domestic one gained a bit while the International one lost a tad:
Domestic TTI: +4.18% (last close +4.07%)
International TTI: +4.91% (last close +5.23%)
Disclosure: I am obliged to inform you that I, as well as advisory clients of mine, own some of these listed ETFs. Furthermore, they do not represent a specific investment recommendation for you, they merely show which ETFs from the universe I track are falling within the guidelines specified.
Contact Ulli