ETF/No Load Fund Tracker Newsletter For May 23, 2014
ETF/No Load Fund Tracker StatSheet
————————————————————-
THE LINK TO OUR CURRENT ETF/MUTUAL FUND STATSHEET IS:
https://theetfbully.com/2014/05/weekly-statsheet-for-the-etfno-load-fund-tracker-newsletter-updated-through-05222014/
————————————————————
Market Commentary
Friday, May 23, 2014
S&P REACHES NEW HEIGHTS HEADING INTO HOLIDAY WEEKEND

[Chart courtesy of MarketWatch.com]
1. Moving The Markets
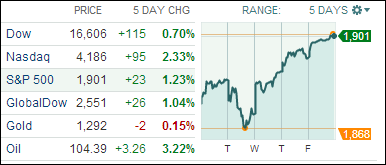
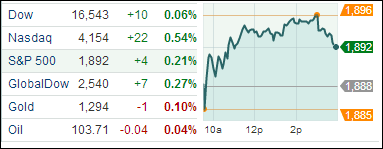
The benchmark S&P 500 set a new closing high today, settling above the 1,900 mark for the first time. U.S. stocks rallied based on earnings and housing data. The day’s gains held, contrary to beliefs there might be selling pressure before the close as U.S. investors headed into a three-day weekend
We heard earnings announcements from Hewlett-Packard (HP) today. Shares jumped 6.1% after reporting fiscal second-quarter earnings that met expectations on sales that slightly under-performed. This news may sound great for investors, but HP also informed us today that it would cut an additional 11,000-16,000 jobs on top of 34,000 previously announced.
For the week, all indexes rose after a taking a breather on Tuesday, as you can see from the above 5-day chart. The Nasdaq ended up being the clear winner.
The meager week for economic data showed that improvement in economic growth continues, slowly but surely. Existing home sales rose 1.3% in April from March, the first increase this year, and new home sales jumped 6.4% in April from March, the largest increase in six months.
Our 10 ETFs in the Spotlight headed higher as well; one new high was made today and 9 of them remain on the plus side YTD.
2. ETFs in the Spotlight
In case you missed the announcement and description of this section, you can read it here again.
It features 10 broadly diversified ETFs from my HighVolume list as posted every Monday. Furthermore, they are screened for the lowest MaxDD% number meaning they have been showing better resistance to temporary sell offs than all others over the past year.
In other words, none of them ever triggered their 7.5% sell stop level during this time period, which included a variety of severe market pullbacks but no move into outright bear market territory.
Here are the 10 candidates:
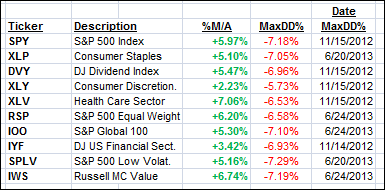
All of them are in “buy” mode, meaning their prices are above their respective long term trend lines by the percentage indicated (%M/A).
Year to date, here’s how the above candidates have fared so far:
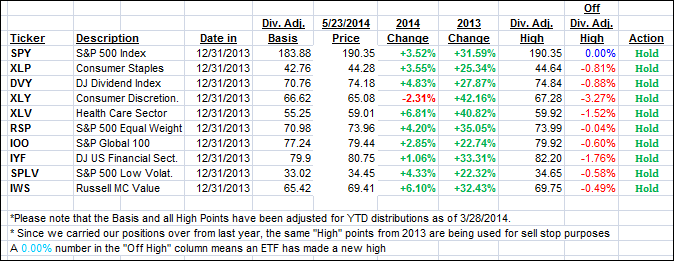
To be clear, the first table above shows the position of the various ETFs in relation to their respective long term trend lines (%M/A), while the second one tracks their trailing sell stops in the “Off High” column. The “Action” column will signal a “Sell” once the -7.5% point is taken out in the “Off High” column.
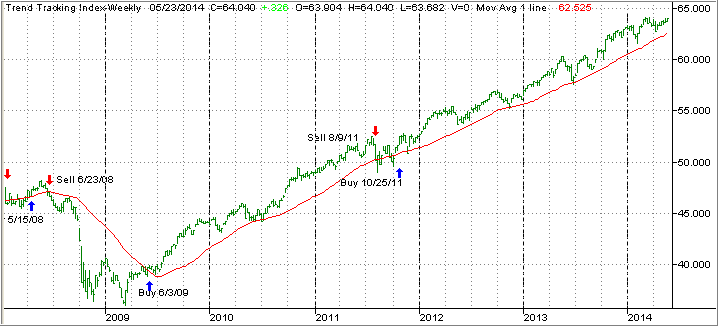
3. Domestic Trend Tracking Indexes (TTIs)
Our Trend Tracking Indexes (TTIs) joined the rebound and moved deeper into the bullish side of their respective trend lines:
Domestic TTI: +2.71% (last Friday +2.09%)
International TTI: +3.73% (last Friday +3.01%)
Have a great weekend.
Ulli…
Disclosure: I am obliged to inform you that I, as well as advisory clients of mine, own some of these listed ETFs. Furthermore, they do not represent a specific investment recommendation for you, they merely show which ETFs from the universe I track are falling within the guidelines specified.
————————————————————-
READER Q & A FOR THE WEEK
All Reader Q & A’s are listed at our web site!
Check it out at:
http://www.successful-investment.com/q&a.php
A note from reader Jack:
Q: Ulli: Given the fact that the markets are hovering in record territory, with the S&P attempting to break through the 1,900 level, what’s your view of bonds in this environment?
A: Jack: If you look at the Total Bond Market index BND, which I don’t own, you’ll see that bonds indeed recovered this year, have come off their lows and broken above their respective long-term trend line into bullish territory.
Still, I think the place to be is equities. If you are looking to get some income while participating in growth, DVY, which we own, has a 2.98% yield and is a member of the 10 ETFs in the Spotlight, which I feature daily in the market commentary. That means it has fairly low volatility, but you still need to guard against unforeseen market drops by applying my recommended sell stop discipline.
———————————————————-
WOULD YOU LIKE TO HAVE YOUR INVESTMENTS PROFESSIONALLY MANAGED?
Do you have the time to follow our investment plans yourself? If you are a busy professional who would like to have his portfolio managed using our methodology, please contact me directly or get more details at:
https://theetfbully.com/personal-investment-management/
———————————————————
Back issues of the ETF/No Load Fund Tracker are available on the web at:
https://theetfbully.com/newsletter-archives/

 The Purchasing Managers Index numbers in the 18-member euro zone were disappointing but were equally consistent with an annual growth forecast of about 1.5 percent, which, if achieved, would be great in what has been witnessed in the euro land generally, said James Bevan, Chief Investment Officer at CCLA Investment Management.