ETF/No Load Fund Tracker StatSheet
————————————————————-
THE LINK TO OUR CURRENT ETF/MUTUAL FUND STATSHEET IS:
————————————————————
Market Commentary
Friday, May 30, 2014
EQUITIES HEADING INTO UNCHARTERED TERRITORY
1. Moving The Markets
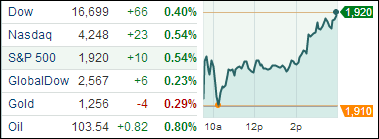
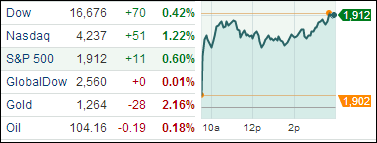
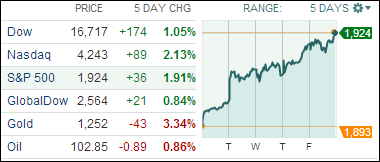
Equities had several new record highs on the week, lifting the tally to 14 new highs in the S&P 500 in 2014. For the week, all major indexes climbed as the 5-day chart above shows. The S&P 500 rose 2.1% in May, which was its fourth consecutive monthly increase. Also, all three primary U.S. stock composites are now positive for the 2014 calendar year. So, things are looking good, at least for the time being, as we head into the summer months.
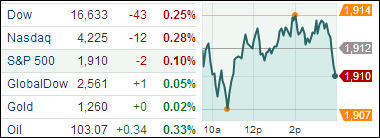
Investors tuned in today to see if the positive momentum would continue or if the weak GDP report yesterday would weigh on stocks today. Although the gross domestic product data was weaker than anticipated, the primary U.S. stock composites still managed to track through positive territory throughout the last session of the month.
Overall, economic data of recent has not been a bit hard to decipher. Personal spending fell 0.1% in April, revised GDP showed the economy contracted by 1.0% in Q1. However, the consumer confidence index rose in May and durable goods orders were up 0.8%. While data is surely mixed, the sentiment among investors is that the economy should (slowly but surely) continue to show solid growth moving forward.
Our 10 ETFs in the Spotlight picked up some steam; 7 of them made new highs today while 9 of them remain on the plus side YTD.