
1. Moving The Markets
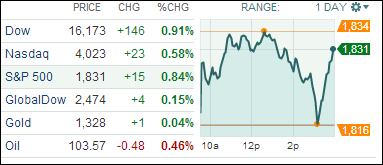
Markets here in the U.S. rallied today after as investors gained confidence from the strong report on March retail sales we received. U.S. retail sales recorded their largest increase in 1.5 years in March, a bigger gain than had been anticipated and the latest sign that the economy is doing well. The S&P 500 gained 0.84%, as the chart above shows, but it was a sloppy day, which remained in roller coaster mode until the close.
Citigroup (C), up 4.4% today, led financial shares higher after the bank reported quarterly earnings that beat expectations, aided by a smaller loss on its troubled assets even as its revenue declined. Bank of America (BAC) gained 1.5% and Morgan Stanley (MS) gained 2.1%.
In other corporate news, Google (GOOG) has acquired New Mexico-based drone maker Titan Aerospace. Titan specializes in building drones capable of staying in the sky for years on end. Google gained 0.36% for the day.
On a positive international note, the World Trade Organization has raised its forecast for growth in global trade this year to 4.7%, but warned that risks such as the slowdown in developing economies and increasing geopolitical tensions, including in Ukraine, could potentially undermine its recovery. Talk about a useless forecast! That’s like saying that the sun will shine tomorrow, unless it’s clowdy and rainy.
Our 10 ETFs in the Spotlight recovered with one of them still remaining below its long term trend line; but 6 of them are positive YTD.
2. ETFs in the Spotlight
In case you missed the announcement and description of this section, you can read it here again.
It features 10 broadly diversified ETFs from my HighVolume list as posted every Monday. Furthermore, they are screened for the lowest MaxDD% number meaning they have been showing better resistance to temporary sell offs than all others over the past year.
In other words, none of them ever triggered their 7.5% sell stop level during this time period, which included a variety of severe market pullbacks but no move into outright bear market territory.
Here are the 10 candidates:
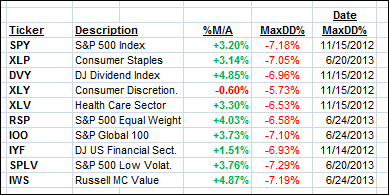
All of them are in “buy” mode, with the exception of XLY, meaning their prices are above their respective long term trend lines by the percentage indicated (%M/A).
Year to date, here’s how the above candidates have fared so far:
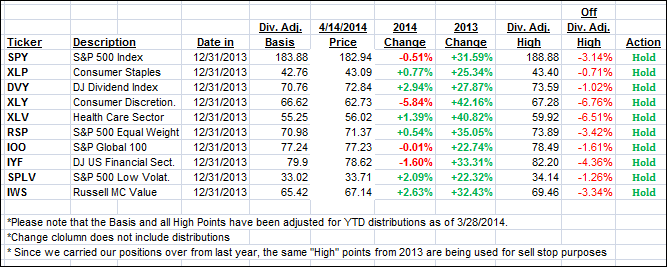
To be clear, the first table above shows the position of the various ETFs in relation to their respective long term trend lines (%M/A), while the second one tracks their trailing sell stops in the “Off High” column. The “Action” column will signal a “Sell” once the -7.5% point is taken out in the “Off High” column.
3. Domestic Trend Tracking Indexes (TTIs)
Our Trend Tracking Indexes (TTIs) recovered today and closed as follows:
Domestic TTI: +1.53% (last close +1.17%)
International TTI: +2.22% (last Friday +1.80%)
Disclosure: I am obliged to inform you that I, as well as advisory clients of mine, own some of these listed ETFs. Furthermore, they do not represent a specific investment recommendation for you, they merely show which ETFs from the universe I track are falling within the guidelines specified.
Contact Ulli