1. Moving The Markets
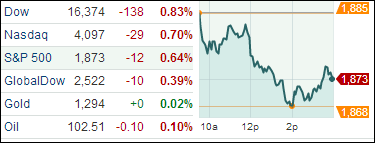
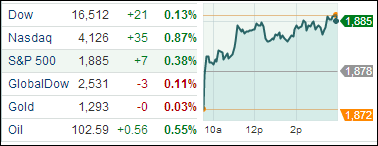
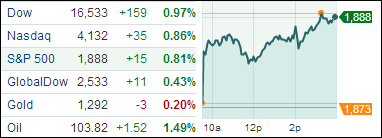
Major U.S. stock indexes mounted a solid comeback today; recovering their losses from the prior day and seeing the Dow log its largest gain in five weeks. As the chart above shows, all major indices gained nicely.
We heard the latest Fed minutes today, but surprisingly there was little reaction from investors, most likely because the minutes were in line with what had been expected; i.e. the economy is recovering but not enough to be considered ‘strong growth’.
Retail stocks, which were a big drag on the markets yesterday, shined bright like a diamond today with Tiffany & Co (TIF) jumping 9.1% after raising its full year profit forecast. After the steep drop in the sector yesterday, the retail sector gained back 1.2% today.
Investors will get a fresh batch of data on housing and the economy on Thursday, as well as earnings from Hewlett-Packard (HP), Best Buy (BBY) and Sears (SHLD), among others.
Our 10 ETFs in the Spotlight moved higher with 9 of them staying on the plus side YTD.