ETF/No Load Fund Tracker Newsletter For June 13, 2014
ETF/No Load Fund Tracker StatSheet
————————————————————-
THE LINK TO OUR CURRENT ETF/MUTUAL FUND STATSHEET IS:
https://theetfbully.com/2014/06/weekly-statsheet-for-the-etfno-load-fund-tracker-newsletter-updated-through-06122014/
————————————————————
Market Commentary
Friday, June 13, 2014
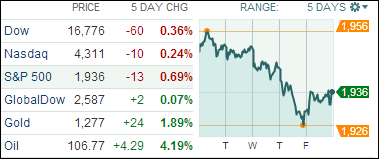
INDEXES SHOW SOME ENTHUSIASM ON FRIDAY, BUT NOT ENOUGH TO MAKE IT A GOOD WEEK OVERALL

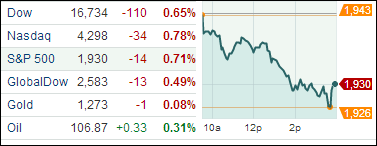
[Chart courtesy of MarketWatch.com]
1. Moving The Markets
The major indexes posted bounced back modestly today, but the recovery was not strong enough to pull the markets back into the green for the week. The S&P 500 added 0.3%, narrowing its weekly loss to 0.7%, while the Nasdaq, which gained 0.3% today, ended the week lower by 0.3%.
The impact of economic news was mixed this week. Slightly disappointing reports on US weekly initial jobless claims and retail sales were offset by near-seven-year highs on small business confidence and job openings. Japan reported a stronger-than-expected upward revision to first-quarter economic growth, and China’s economy showed signs of stabilizing via its increased industrial production and retail sales growth.
We did hear some continued M&A news of interest this week though. Tyson Foods (TYS) upped the ante to $63/share in its persistent quest for Hillshire Brands (HSH). Pharmaceutical giant Merck (MRK) has agreed to buy Idenix Pharmaceuticals (IDIX), a developer of drugs that fight hepatitis C, at $24.50/share totaling $3.85 billion, which is 3x its current market price. Finally, we also heard this week that Botox maker Allergan (AGN) rejected a higher $53 billion takeover bid by Valeant Pharmaceuticals International (VRX), saying that it still did not offer enough value.
Our 10 ETFs in the Spotlight slipped with 9 of them staying on the plus side YTD.
2. ETFs in the Spotlight
In case you missed the announcement and description of this section, you can read it here again.
It features 10 broadly diversified ETFs from my HighVolume list as posted every Monday. Furthermore, they are screened for the lowest MaxDD% number meaning they have been showing better resistance to temporary sell offs than all others over the past year.
In other words, none of them ever triggered their 7.5% sell stop level during this time period, which included a variety of severe market pullbacks but no move into outright bear market territory.
Here are the 10 candidates:
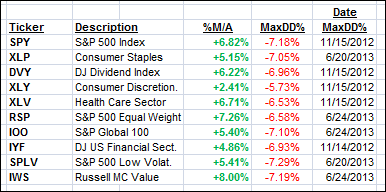
All of them are in “buy” mode, meaning their prices are above their respective long term trend lines by the percentage indicated (%M/A).
Year to date, here’s how the above candidates have fared so far:
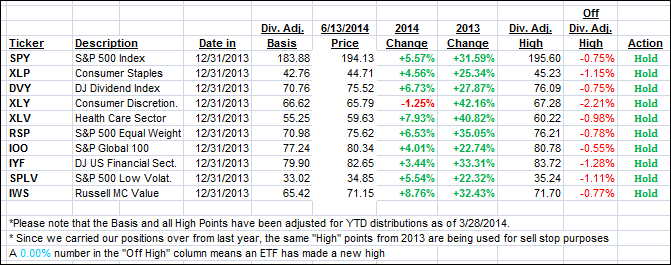
To be clear, the first table above shows the position of the various ETFs in relation to their respective long term trend lines (%M/A), while the second one tracks their trailing sell stops in the “Off High” column. The “Action” column will signal a “Sell” once the -7.5% point is taken out in the “Off High” column.
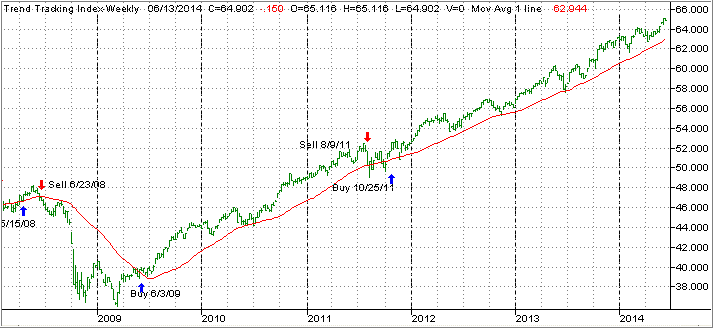
3. Domestic Trend Tracking Indexes (TTIs)
Our Trend Tracking Indexes (TTIs) retreated with the indexes but remain firmly entrenched on the bullish side of their respective trend lines:
Domestic TTI: +3.15% (last Friday +3.55%)
International TTI: +4.24% (last Friday +4.85%)
Have a great weekend.
Ulli…
Disclosure: I am obliged to inform you that I, as well as advisory clients of mine, own some of these listed ETFs. Furthermore, they do not represent a specific investment recommendation for you, they merely show which ETFs from the universe I track are falling within the guidelines specified.
————————————————————-
READER Q & A FOR THE WEEK
All Reader Q & A’s are listed at our web site!
Check it out at:
http://www.successful-investment.com/q&a.php
A note from reader Jason:
Q: Ulli: Could you please clarify the difference between your M-Index and the momentum numbers as posted in your Monday Cutline reports? I find this information very valuable.
A: Jason: The M-Index is the ranking based on all momentum numbers and shows how funds/ETFs rank comparatively. The Cutline position numbers are simply showing the positions a fund/ETF has relative to its cutline or trend line.
For example, the first one above the yellow cutline has the position +1, the next one above it +2 and so on. The same applies below the cutline. As time goes on, you can quickly determine which funds are bouncing around the cutline and which ones are developing upside momentum by steadily climbing higher and developing positive momentum numbers.
———————————————————-
WOULD YOU LIKE TO HAVE YOUR INVESTMENTS PROFESSIONALLY MANAGED?
Do you have the time to follow our investment plans yourself? If you are a busy professional who would like to have his portfolio managed using our methodology, please contact me directly or get more details at:
https://theetfbully.com/personal-investment-management/
———————————————————
Back issues of the ETF/No Load Fund Tracker are available on the web at:
https://theetfbully.com/newsletter-archives/

 When the US Federal Reserve says there’s a slack in the economy, it means lack of activity in the labor market and an unemployment rate higher than where it should be to generate sufficient inflation, said Neil Dutta, head of US Macroeconomics at Renaissance Macro Research.