ETFs/Mutual Funds On The Cutline – Updated Through 05/09/2014

Ulli ETFs on the Cutline Contact

Below are the latest ETF Cutline reports, which show how far above or below their respective long-term trend lines (39 week SMA) my currently tracked ETFs/MFs are positioned.

The first report covers the ETF Master List from Thursday’s StatSheet and includes 398 ETFs, of which currently 338 (last week 360) are hovering in bullish territory.

The second report includes only High Volume ETFs. To clarify, High Volume (HV) ETFs are defined as those with an average daily volume of $10 million or higher.

These ETFs are generated from my selected list of some 97 that I use in my advisor practice. It cuts out the “noise,” which simply means it eliminates those ETFs that I would never buy because of their volume limitations. 75 ETFs (last week 81) have managed to remain in bullish territory after the recent market volatility.

The third report covers Mutual Funds on the Cutline. There are currently 587 (last week 658) above the line and 262 below it out of the 859 that I follow.

Take a look:

1. ETF Master Cutline Report     

2. ETF High Volume Cutline Report

3. MF Cutline Report

In case you are not familiar with some of the terminology used in the reports, please read the Glossary of Terms.

If you missed the original post about the Cutline approach, you can read it here.

One Man’s Opinion: Is Housing Likely To Lag Behind The Rest Of The Economy?

Ulli Market Review Contact

92835431

Housing is not quite as important as the Fed sometimes seem to think, said Ian Shepherdson, Chief Economist at Pantheon Macroeconomics. The Fed seems to be as much obsessed with housing as much the labor market, but it’s not necessary for housing to keep charging upwards for the rest of the economy to grow.

It’s a relatively small share of GDP now in terms of housing construction, even when one adds in the retail stuff that’s related to housing. But it’s important to sentiment as everybody seems to be obsessed with house prices. The rebound in house values has drastically improved the personal sector’s balance sheet. The Fed is certainly very concerned about it in a way perhaps two or three months ago they weren’t; they were ready to dismiss it as something temporary. And now their worries are much deeper it seems, he noted.

Asked if housing could roll over as yields and interest rates move up, Ian answered in affirmative. Over the last year, the affordability index has declined sharply, marking the biggest drop in 30 years. If mortgage rates rise further as the rest of the economy picks up, then housing would be under further pressure. It’s kind of a paradox here that the stronger the economy gets, the more the market gets worried about the Fed raising rates, the higher 10-year yields will go and the higher the mortgage rates will go and potentially the weaker the housing market will get, he argued.

Read More

New ETFs On The Block: EGShares Blue Chip ETF (BCHP)

Ulli Emerging Markets ETFs Contact

91551519Emerging Global Advisors, the New York-based issuer specializing in emerging market exchange traded funds, has unveiled a self-indexed fund that offers investors exposure to a basket of developed market companies with quality, substantial and growing revenue from emerging markets.

The EGShares Blue Chip ETF (BCHP) tracks the EGAI Developed Markets Blue Chip EM Access Index, an equally-weighted 30 stock index that measures the performance of multinationals domiciled in the US, Europe and other developed markets, buts get a large share of their revenues from emerging markets.

Since the US Fed’s announcement of tapering last year, emerging market ETFs saw massive capital outflows, as investors assumed a rate-hike announcement from the central bank will follow soon, which, in turn, would push up yields. Unfortunately, the yield-rise forecasts didn’t materialize as the US Fed repeatedly asserted slack in the economy, indicating a rate hike is nowhere on the horizon.

Read More

05-09-2014

Ulli Newsletter Archives Contact

ETF/No Load Fund Tracker Newsletter For May 9, 2014

ETF/No Load Fund Tracker StatSheet

————————————————————-

THE LINK TO OUR CURRENT ETF/MUTUAL FUND STATSHEET IS:

https://theetfbully.com/2014/05/weekly-statsheet-for-the-etfno-load-fund-tracker-newsletter-updated-through-05082014/

————————————————————

Market Commentary

Friday, May 9, 2014

DOW SQUEEZES TO NEW HIGH AS THE END OF Q1’s EARNINGS SEASON APPROACHES

Fri pic

[Chart courtesy of MarketWatch.com]

1. Moving The Markets

The Dow squeezed past a new record high today, gaining 0.2%. However, celebrations remained fairly mild given that the Dow’s performance is essentially flat for the year. The S&P 500 and the Nasdaq both closed out the day in positive territory, which was a nice way to end a rather sour week of trading given the continued selloff of high-flying tech and biotech stocks.

Throughout the week it has been hard to overlook the headlines surrounding the upcoming IPO of Alibaba later this year. Wall Street analysts remain optimistic on Alibaba, due to its huge size and growth potential in the massive Chinese online consumer market. Many are speculating that the IPO will be the largest of all time and thus has the potential to top the $17.9 billion IPO of Visa.

Well, the Q1 earnings season is coming to a close, and near final results show that corporations are continuing to fare well.  With 90% of companies in the S&P 500 having reported first-quarter results, earnings are up 5.4% year-over-year and 69% of companies have posted better-than-expected earnings according to Thompson Reuters. This all bodes well for an optimistic outlook on continued economic growth as we continue on into the second quarter of the year.

Nonetheless, markets remain stuck in a sideways pattern, plagued by overvaluation speculation and remnants of the gains many realized on the mega performance of 2013’s market.

Our 10 ETFs in the Spotlight went sideways during this bouncy week; however, one of them made a new high today and 9 of them are on the plus side YTD.

2. ETFs in the Spotlight

In case you missed the announcement and description of this section, you can read it here again.

It features 10 broadly diversified ETFs from my HighVolume list as posted every Monday. Furthermore, they are screened for the lowest MaxDD% number meaning they have been showing better resistance to temporary sell offs than all others over the past year.

In other words, none of them ever triggered their 7.5% sell stop level during this time period, which included a variety of severe market pullbacks but no move into outright bear market territory.

Here are the 10 candidates:

MaxDD

All of them are in “buy” mode, meaning their prices are above their respective long term trend lines by the percentage indicated (%M/A).

Year to date, here’s how the above candidates have fared so far:

YTD

To be clear, the first table above shows the position of the various ETFs in relation to their respective long term trend lines (%M/A), while the second one tracks their trailing sell stops in the “Off High” column. The “Action” column will signal a “Sell” once the -7.5% point is taken out in the “Off High” column.

3. Domestic Trend Tracking Indexes (TTIs)

Our Trend Tracking Indexes (TTIs) slipped from last Friday’s close but remain above their respective long-term trend lines by the following percentages:

Domestic TTI: +2.05% (last Friday +2.42%)

International TTI: +2.87% (last Friday +3.61%)

Have a great weekend.

Ulli…

Disclosure: I am obliged to inform you that I, as well as advisory clients of mine, own some of these listed ETFs. Furthermore, they do not represent a specific investment recommendation for you, they merely show which ETFs from the universe I track are falling within the guidelines specified.

————————————————————-

READER Q & A FOR THE WEEK

All Reader Q & A’s are listed at our web site!
Check it out at:

http://www.successful-investment.com/q&a.php

A note from reader Joseph:

Q: Ulli: This is more a comment than a question. I really like your 10 ETFs in the Spotlight addition, which I follow daily. I used to be the type of investor who could not be invested in too many mutual funds and/or ETFs.

I now use the spotlight ETFs as my guide, have reduced my total holdings sharply, update my trailing stops daily and have found that my investing endeavors currently not only take much less time but also have reduced my emotional decision making in the process. I am much more relaxed and feel confident that I can better handle the uncertainties of the market place. Thanks for that.

A: Joseph: While I don’t dwell on this often enough, the issues you have addressed exactly describe the main benefits of the trend tracking methodology. Having a plan in place that deals with whatever the market gives you, let’s you make better decisions and, as importantly, allows you to sleep better at night.

———————————————————-

WOULD YOU LIKE TO HAVE YOUR INVESTMENTS PROFESSIONALLY MANAGED?

Do you have the time to follow our investment plans yourself? If you are a busy professional who would like to have his portfolio managed using our methodology, please contact me directly or get more details at:

https://theetfbully.com/personal-investment-management/

———————————————————

Back issues of the ETF/No Load Fund Tracker are available on the web at:

https://theetfbully.com/newsletter-archives/

ETF/No Load Fund Tracker Newsletter For May 9, 2014

Ulli ETF Tracker Contact

ETF/No Load Fund Tracker StatSheet

————————————————————-

THE LINK TO OUR CURRENT ETF/MUTUAL FUND STATSHEET IS:

https://theetfbully.com/2014/05/weekly-statsheet-for-the-etfno-load-fund-tracker-newsletter-updated-through-05082014/

————————————————————

Market Commentary

Friday, May 9, 2014

DOW SQUEEZES TO NEW HIGH AS THE END OF Q1’s EARNINGS SEASON APPROACHES

Fri pic

[Chart courtesy of MarketWatch.com]

1. Moving The Markets

The Dow squeezed past a new record high today, gaining 0.2%. However, celebrations remained fairly mild given that the Dow’s performance is essentially flat for the year. The S&P 500 and the Nasdaq both closed out the day in positive territory, which was a nice way to end a rather sour week of trading given the continued selloff of high-flying tech and biotech stocks.

Throughout the week it has been hard to overlook the headlines surrounding the upcoming IPO of Alibaba later this year. Wall Street analysts remain optimistic on Alibaba, due to its huge size and growth potential in the massive Chinese online consumer market. Many are speculating that the IPO will be the largest of all time and thus has the potential to top the $17.9 billion IPO of Visa.

Well, the Q1 earnings season is coming to a close, and near final results show that corporations are continuing to fare well.  With 90% of companies in the S&P 500 having reported first-quarter results, earnings are up 5.4% year-over-year and 69% of companies have posted better-than-expected earnings according to Thompson Reuters. This all bodes well for an optimistic outlook on continued economic growth as we continue on into the second quarter of the year.

Nonetheless, markets remain stuck in a sideways pattern, plagued by overvaluation speculation and remnants of the gains many realized on the mega performance of 2013’s market.

Our 10 ETFs in the Spotlight went sideways during this bouncy week; however, one of them made a new high today and 9 of them are on the plus side YTD.

Read More

Weekly StatSheet For The ETF/No Load Fund Tracker Newsletter – Updated Through 05/08/2014

Ulli ETF Tracker Contact

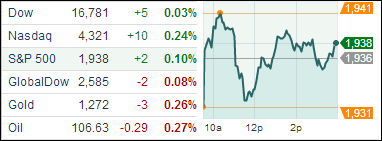
ETF/Mutual Fund Data updated through Thursday, May 8, 2014

Table of Content082312

If you are not familiar with some of the terminology used, please see the Glossary of Terms.


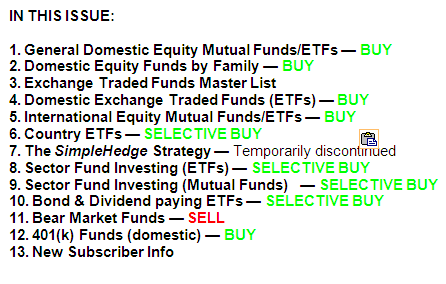
1. DOMESTIC EQUITY MUTUAL FUNDS/ETFs: BUY — since 10/25/2011

TTI

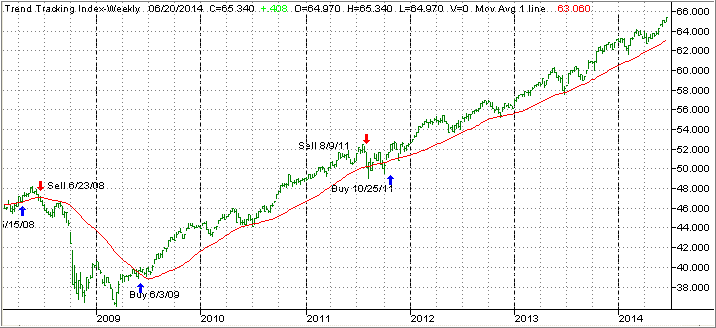
Our main directional indicator, the Domestic Trend Tracking Index (TTI), broke through its long-term trend line generating a Sell for this area effective 8/9/2011. Over the recent past, we’ve seen the TTI hovering slightly below and above this dividing line between bullish and bearish territory. The clear break to the upside occurred on 10/24/11 and, effective 10/25/11, a new Buy signal for domestic equities went into effect.

As of today, our TTI (green line in above chart) is positioned above its long term trend line (red) by +2.03%.

To avoid a potential whip-saw, a Sell signal to move out of all domestic equity positions will be generated once we have clearly pierced the red line to the downside. Be sure to tune in for the latest updates.

Read More