
1. Moving The Markets
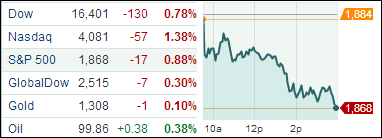
Markets took a hit today, a day after the Dow and S&P 500 closed near record highs. The Nasdaq took the largest hit, while the S&P and Dow dropped dropped by lesser percentages. Again, we see the Nasdaq, which is filled with those big momentum social media and tech stocks, showing the highest sensitivity to market volatilities.
Twitter (TWTR) shares led the plunge, officially hitting a new low as company insiders became eligible to sell their stock today as their “lock-up” period ended. Under federal securities law, company founders and executives must wait six months before selling any shares following an initial public offering. Netflix (NFLX), TripAdvisor (TRIP) and Amazon (AMZN) all took a beating as well today, while Target (TGT) shares continued to tumble following the exit of their CEO yesterday. In short, it was not a good day for the big momentum stocks that have captured so many headlines so far this year.
In more positive news, I saw a report today that the U.S. trade deficit narrowed in March as exports rose to the second highest level on record. Sales of aircraft, autos and farm goods were the big leaders. The deficit declined to $40.4 billion, down 3.6 percent from a revised February imbalance of $41.9 billion.
Our 10 ETFs in the Spotlight slipped with 8 of them remaining on the plus side YTD.
2. ETFs in the Spotlight
In case you missed the announcement and description of this section, you can read it here again.
It features 10 broadly diversified ETFs from my HighVolume list as posted every Monday. Furthermore, they are screened for the lowest MaxDD% number meaning they have been showing better resistance to temporary sell offs than all others over the past year.
In other words, none of them ever triggered their 7.5% sell stop level during this time period, which included a variety of severe market pullbacks but no move into outright bear market territory.
Here are the 10 candidates:
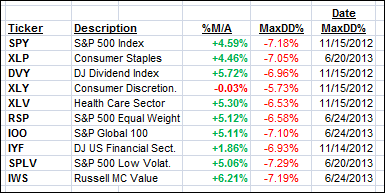
All of them, with the exception of XLY, are in “buy” mode, meaning their prices are above their respective long term trend lines by the percentage indicated (%M/A).
Year to date, here’s how the above candidates have fared so far:
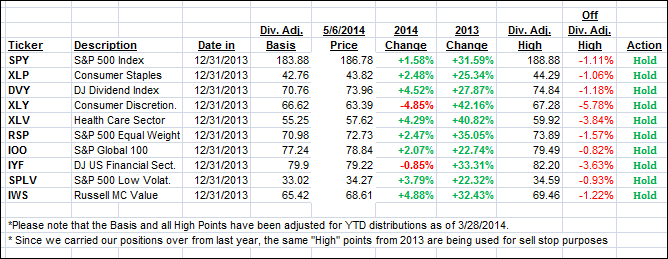
To be clear, the first table above shows the position of the various ETFs in relation to their respective long term trend lines (%M/A), while the second one tracks their trailing sell stops in the “Off High” column. The “Action” column will signal a “Sell” once the -7.5% point is taken out in the “Off High” column.
3. Domestic Trend Tracking Indexes (TTIs)
Our Trend Tracking Indexes (TTIs) pulled back with the indexes but remain above their respective long-term trend lines by the following percentages:
Domestic TTI: +2.00% (last close +2.52%)
International TTI: +3.43% (last close +3.64%)
Disclosure: I am obliged to inform you that I, as well as advisory clients of mine, own some of these listed ETFs. Furthermore, they do not represent a specific investment recommendation for you, they merely show which ETFs from the universe I track are falling within the guidelines specified.
Contact Ulli