ETF/No Load Fund Tracker Newsletter For June 20, 2014
ETF/No Load Fund Tracker StatSheet
————————————————————-
THE LINK TO OUR CURRENT ETF/MUTUAL FUND STATSHEET IS:
https://theetfbully.com/2014/06/weekly-statsheet-for-the-etfno-load-fund-tracker-newsletter-updated-through-06192014/
————————————————————
Market Commentary
Friday, June 20, 2014
STOCKS ON PATH OF RECORD BREAKING TRAIL

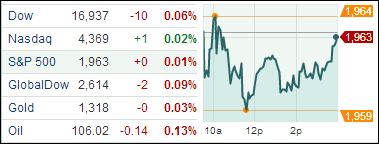
[Chart courtesy of MarketWatch.com]
1. Moving The Markets
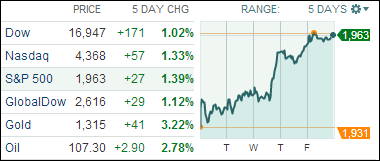
Stocks nudged deeper into record territory today, rounding out a solid week of gains for the market. For the week, the three major U.S. stock indexes rose 1 percent respectively. The Dow is now within 53 points of 17,000 while the Standard & Poor’s 500 is just shy of 2,000 after rising 6 percent this year.
As we all know, M&A deals have been a big market mover this year. The value of corporate deals has surged 62 percent to $798 billion this year, from $494 billion a year ago, even though the number of acquisitions is about 3 percent lower than last year, according to Dealogic. Earlier this week, we saw Tyson Foods (TYS) finally win the bidding war to buy Hillshire (HSH) for $8.6 billion on Monday. The company ended up paying $63 a share for the food company about two weeks after rival poultry producer Pilgrim’s Pride (PPC) made an initial bid of $45 a share.
The economy fared pretty well this week, and the stock market reacted positively to the Federal Reserve’s announcement on Wednesday, in which the Fed noted that “growth in economic activity has rebounded in recent months,” supporting the case that the steady reduction in asset purchases is indicative of the Fed’s belief that the economy is on stable footing. The Fed’s commentary seemed consistent with general sentiment of a modestly growing economy, a slowly improving labor market, and moderate inflation.
Our 10 ETFs in the Spotlight gained for the week with 4 of them making new highs today; 9 of them are remaining on the plus side YTD.
2. ETFs in the Spotlight
In case you missed the announcement and description of this section, you can read it here again.
It features 10 broadly diversified ETFs from my HighVolume list as posted every Monday. Furthermore, they are screened for the lowest MaxDD% number meaning they have been showing better resistance to temporary sell offs than all others over the past year.
In other words, none of them ever triggered their 7.5% sell stop level during this time period, which included a variety of severe market pullbacks but no move into outright bear market territory.
Here are the 10 candidates:
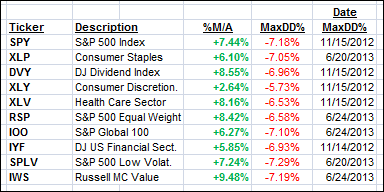
All of them are in “buy” mode, meaning their prices are above their respective long term trend lines by the percentage indicated (%M/A).
Year to date, here’s how the above candidates have fared so far:
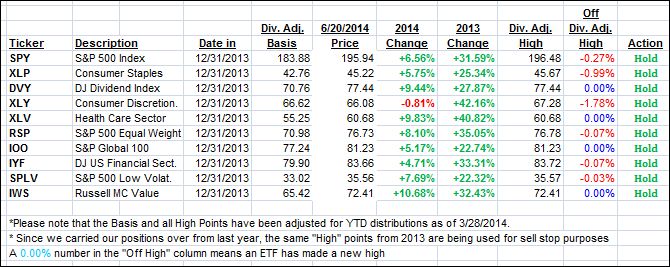
To be clear, the first table above shows the position of the various ETFs in relation to their respective long term trend lines (%M/A), while the second one tracks their trailing sell stops in the “Off High” column. The “Action” column will signal a “Sell” once the -7.5% point is taken out in the “Off High” column.
3. Domestic Trend Tracking Indexes (TTIs)
Our Trend Tracking Indexes (TTIs) joined the bulls and headed higher closing the week as follows:
Domestic TTI: +3.68% (last Friday +3.36%)
International TTI: +4.66% (last Friday +4.52%)
Have a great weekend.
Ulli…
Disclosure: I am obliged to inform you that I, as well as advisory clients of mine, own some of these listed ETFs. Furthermore, they do not represent a specific investment recommendation for you, they merely show which ETFs from the universe I track are falling within the guidelines specified.
————————————————————-
READER Q & A FOR THE WEEK
All Reader Q & A’s are listed at our web site!
Check it out at:
http://www.successful-investment.com/q&a.php
A note from reader Roslyn:
Q: Ulli: This is in regards to your 10 ETFs in the spotlight. I noticed that XLY has been lagging all year and merely bouncing around its long-term trend line without making any headway. Are you planning to replace this laggard at some time?
A: Roslyn: Yes, I will reevaluate all 10 ETFs at some point, probably the end of the year and replace them with those that fall within the stated guidelines of having a low MaxDD percentage. In the meantime, stick with those that are performing well or make your selections from Thursday’s StatSheet.
———————————————————-
WOULD YOU LIKE TO HAVE YOUR INVESTMENTS PROFESSIONALLY MANAGED?
Do you have the time to follow our investment plans yourself? If you are a busy professional who would like to have his portfolio managed using our methodology, please contact me directly or get more details at:
https://theetfbully.com/personal-investment-management/
———————————————————
Back issues of the ETF/No Load Fund Tracker are available on the web at:
https://theetfbully.com/newsletter-archives/