
1. Moving The Markets
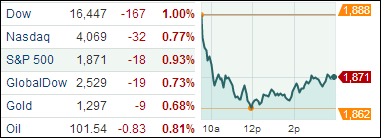
It was a one-two punch based on disappointing earnings and a mixed bag of data that sent the bulls to the mat, at least for the time being. All major indexes lost as the intra-day chart above shows.
Despite the manufacturing index coming in better than expected and a reduced number of individuals filing for initial jobless benefits, industrial production dropped last month, even though a rise was expected, which took the starch out of any upside momentum.
The CPI and PPI numbers provided a mixed picture and ended up not helping any bullish cause. Adding downside pressure were poor economic data coming out of Europe; it was so weak that even the conservative German Bundesbank indicated that is looking to support monetary stimulus as growth seems to have stalled.
Our 10 ETFs in the Spotlight retreated; one slipped below its long-term trend line, but 8 of them are remaining on the plus side YTD.
2. ETFs in the Spotlight
In case you missed the announcement and description of this section, you can read it here again.
It features 10 broadly diversified ETFs from my HighVolume list as posted every Monday. Furthermore, they are screened for the lowest MaxDD% number meaning they have been showing better resistance to temporary sell offs than all others over the past year.
In other words, none of them ever triggered their 7.5% sell stop level during this time period, which included a variety of severe market pullbacks but no move into outright bear market territory.
Here are the 10 candidates:
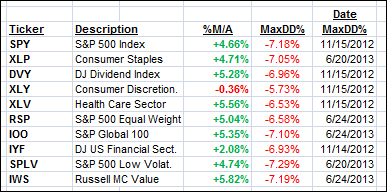
All of them, with the exception of XLY, are in “buy” mode, meaning their prices are above their respective long term trend lines by the percentage indicated (%M/A).
Year to date, here’s how the above candidates have fared so far:
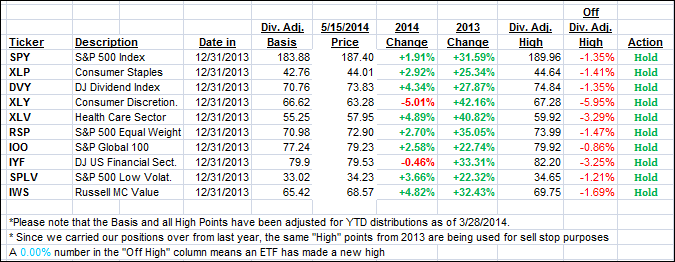
To be clear, the first table above shows the position of the various ETFs in relation to their respective long term trend lines (%M/A), while the second one tracks their trailing sell stops in the “Off High” column. The “Action” column will signal a “Sell” once the -7.5% point is taken out in the “Off High” column.
3. Domestic Trend Tracking Indexes (TTIs)
Our Trend Tracking Indexes (TTIs) headed south and ended up as follows:
Domestic TTI: +2.11% (last close +2.41%)
International TTI: +3.14% (last close +3.71%)
Disclosure: I am obliged to inform you that I, as well as advisory clients of mine, own some of these listed ETFs. Furthermore, they do not represent a specific investment recommendation for you, they merely show which ETFs from the universe I track are falling within the guidelines specified.
Contact Ulli