Bond Yields Drop Slightly As Markets Struggle

Ulli Market Commentary Contact

[Chart courtesy of MarketWatch.com]

  1. Moving the market

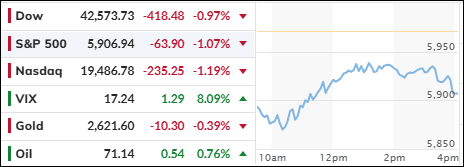
The markets opened sharply lower today, with bullish sentiment notably absent as the major indexes fell more than 1.5%.

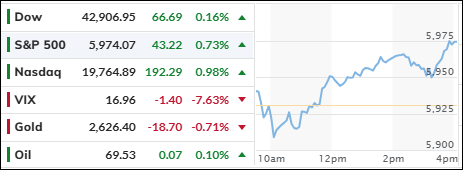
However, they managed to bounce back from their worst levels of the day. Despite the light trading volume typical of a holiday-shortened week, traders found no clear catalyst for the market’s movements. Even lower bond yields couldn’t prevent the bears from dominating.

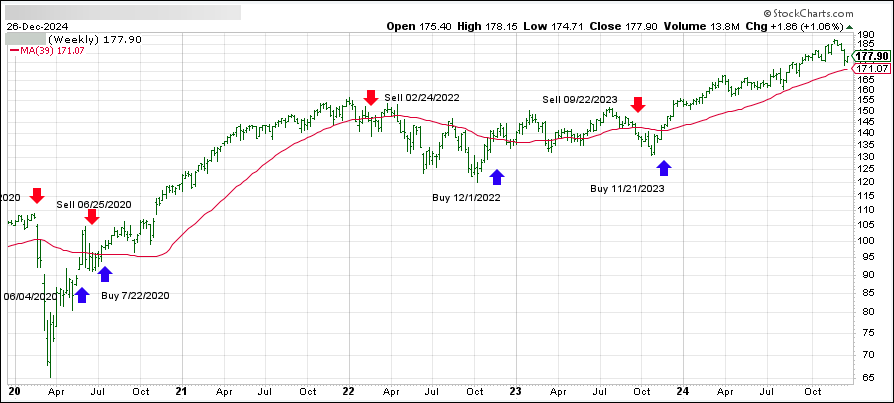
Although the major indexes are still below their record highs, they have posted some of the best year-to-date gains since 2021. The S&P 500 and Dow are up over 25% and 14%, respectively, while the Nasdaq leads with a gain of over 31%.

Nevertheless, concerns are growing that year-end profit-taking has sapped upward momentum after recent losses, suggesting a possible pause following the significant upswing.

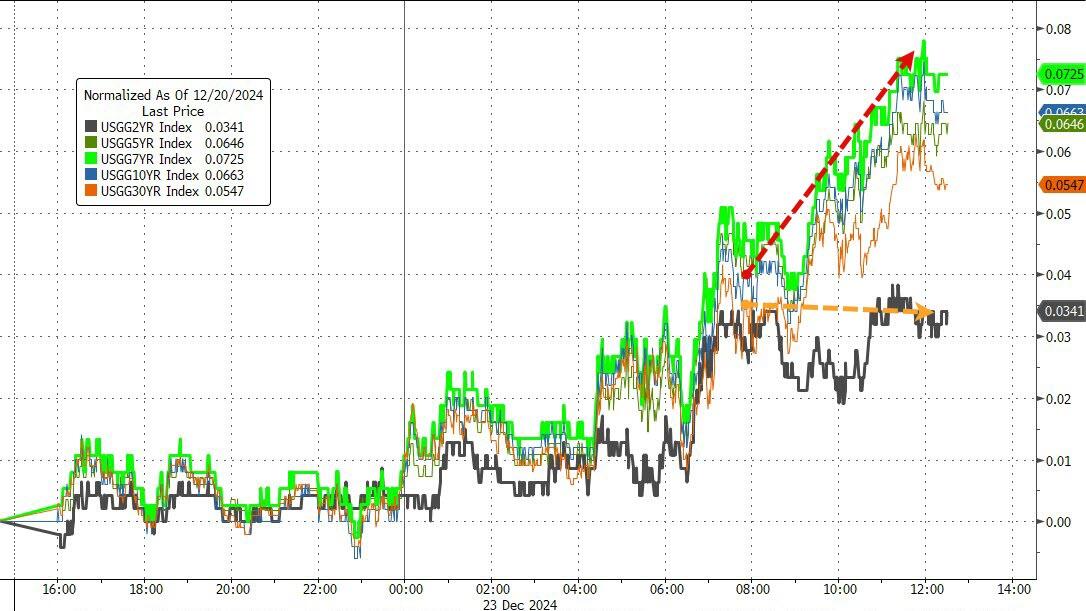
Surging bond yields, despite the Federal Reserve’s efforts to lower them, have contributed to recent market weakness. It remains to be seen if this trend will continue to negatively impact markets as we enter 2025.

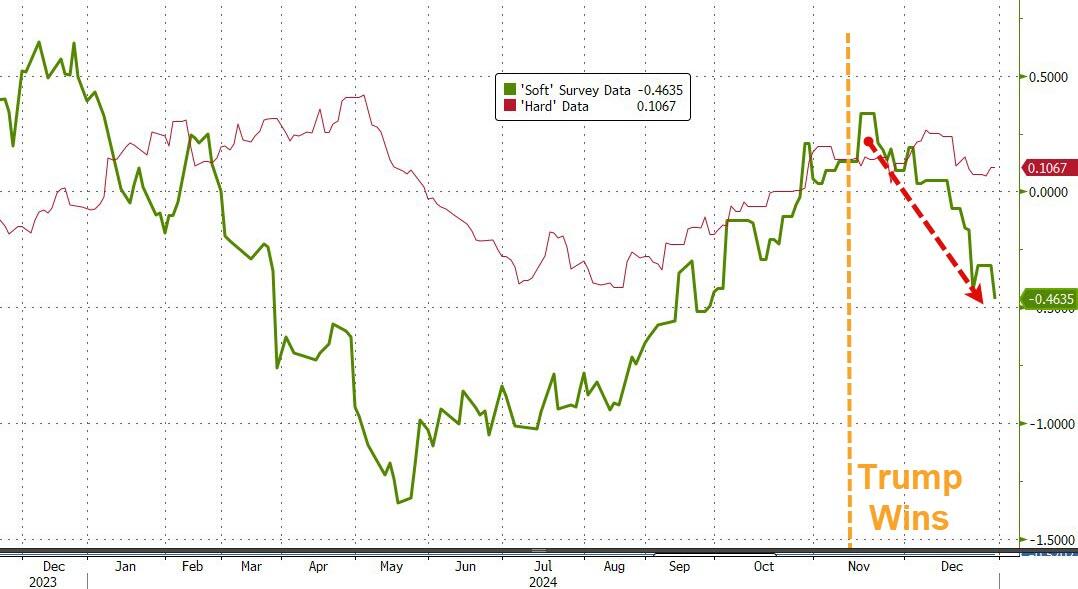
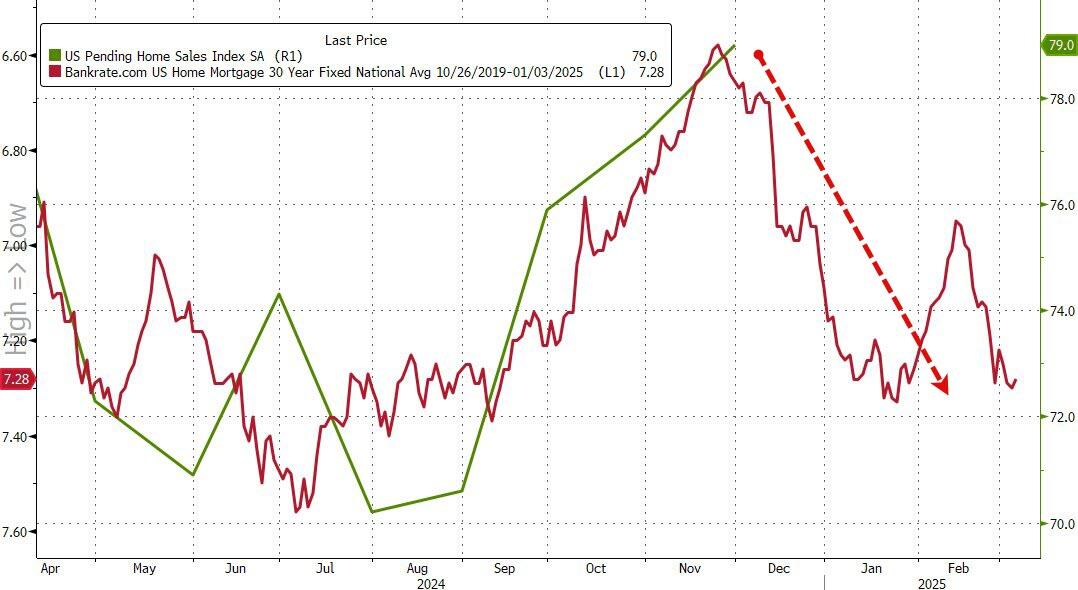
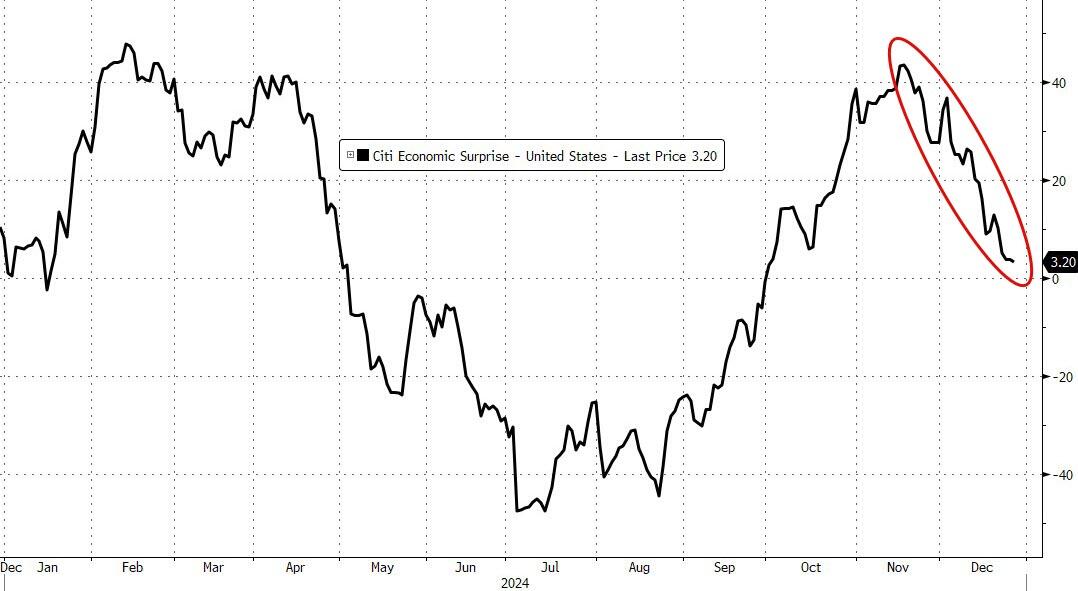
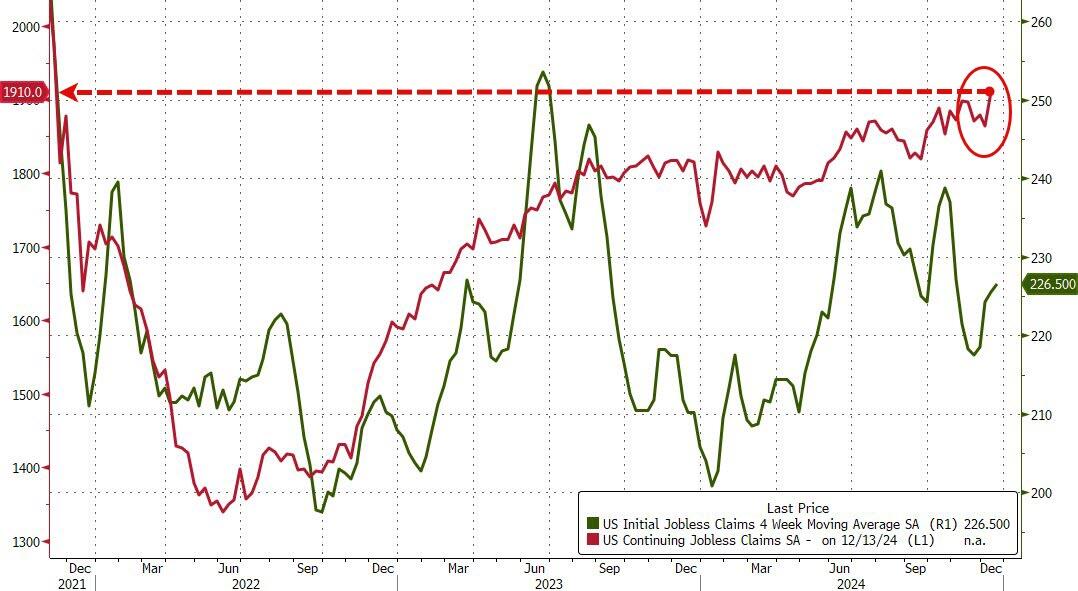
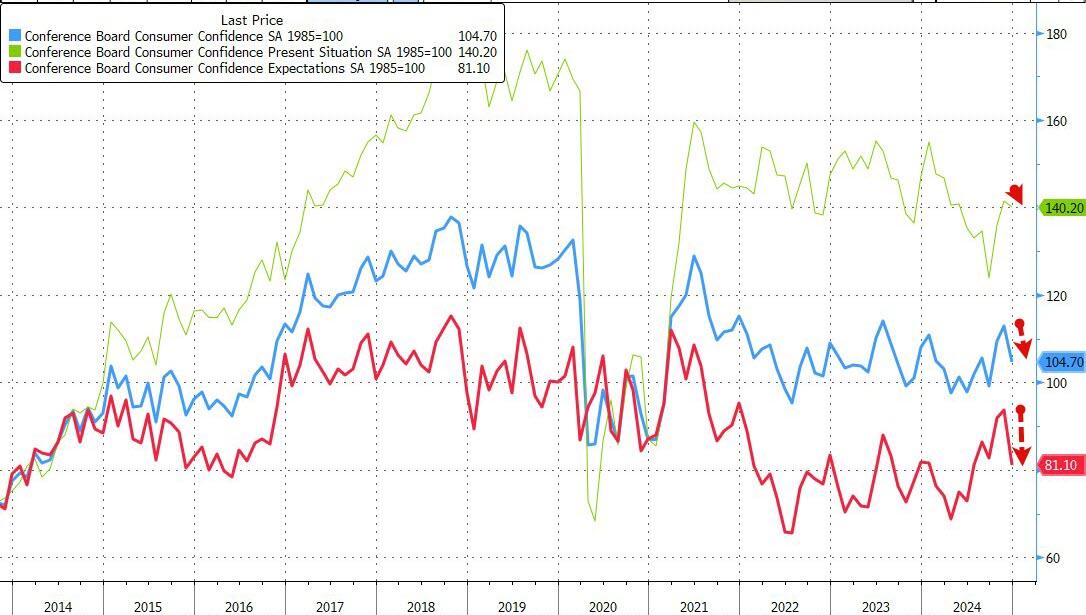
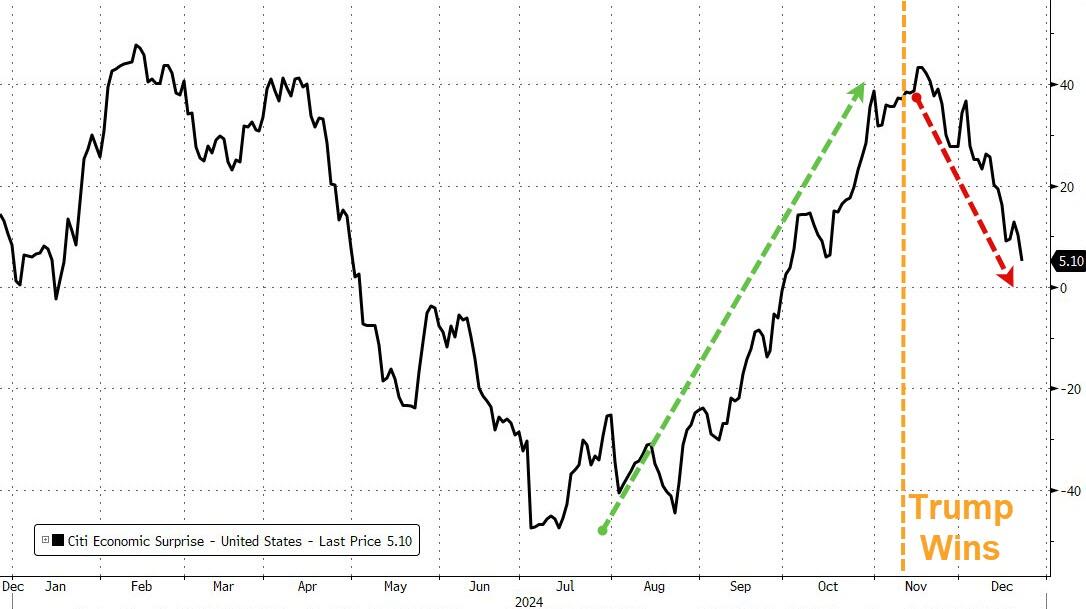
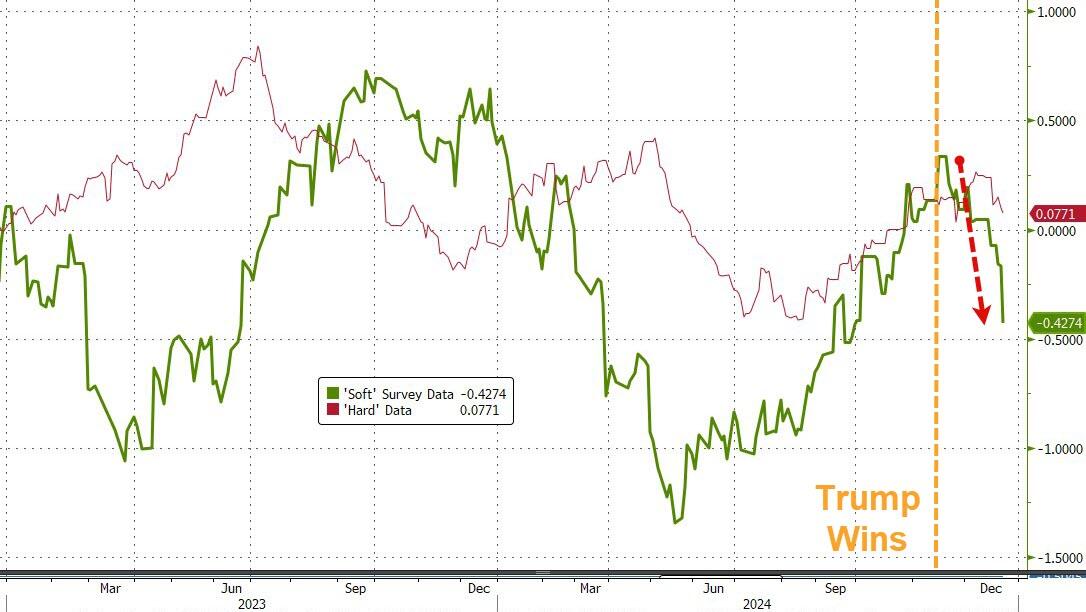
Soft survey data continued its post-election decline, while Pending Home Sales exceeded expectations but diverged from rising interest rates.

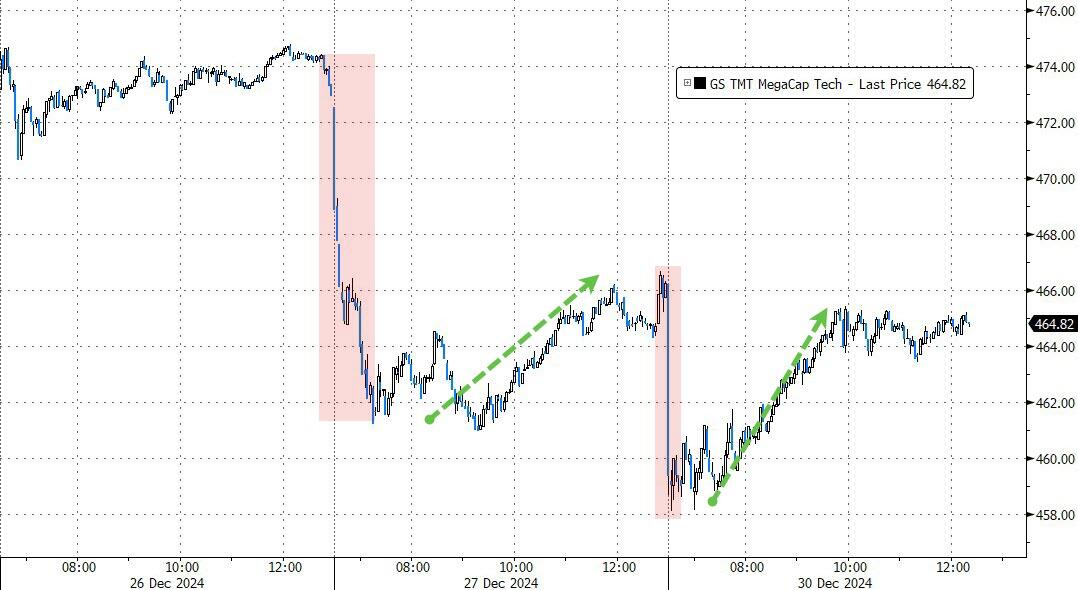
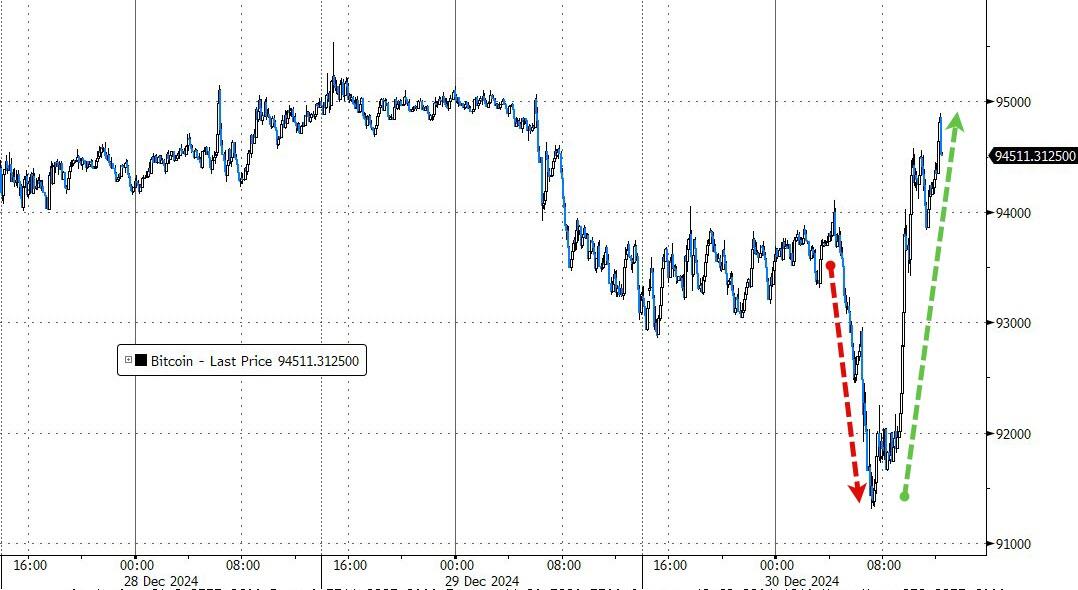
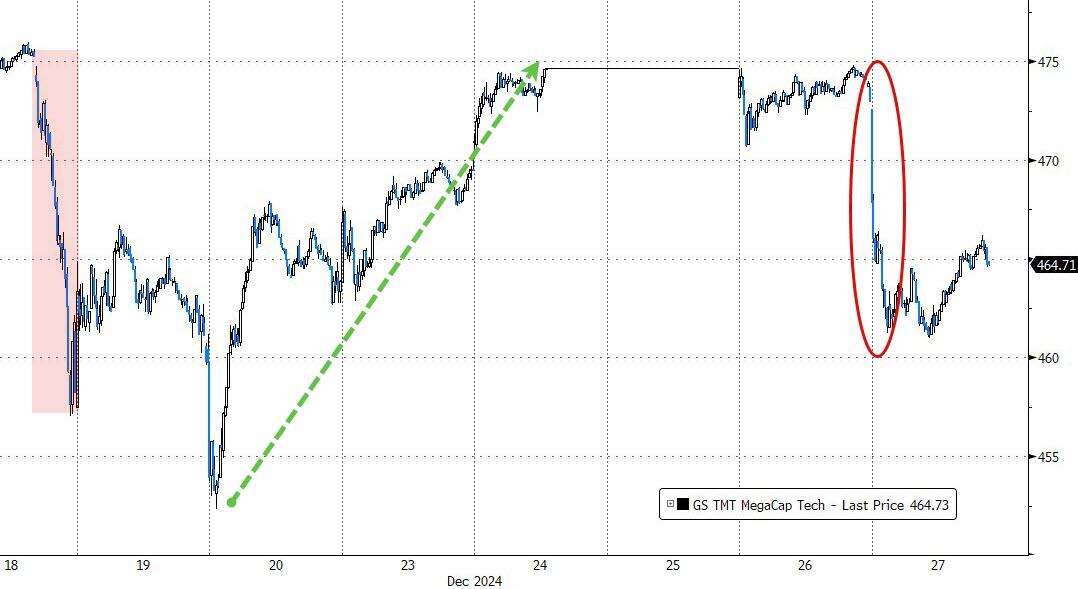
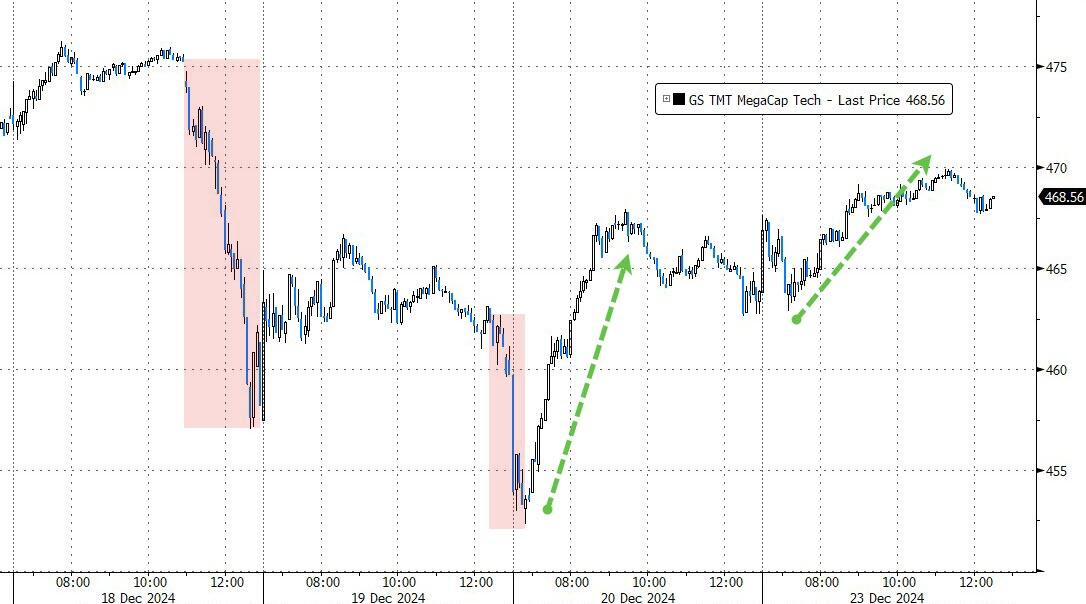
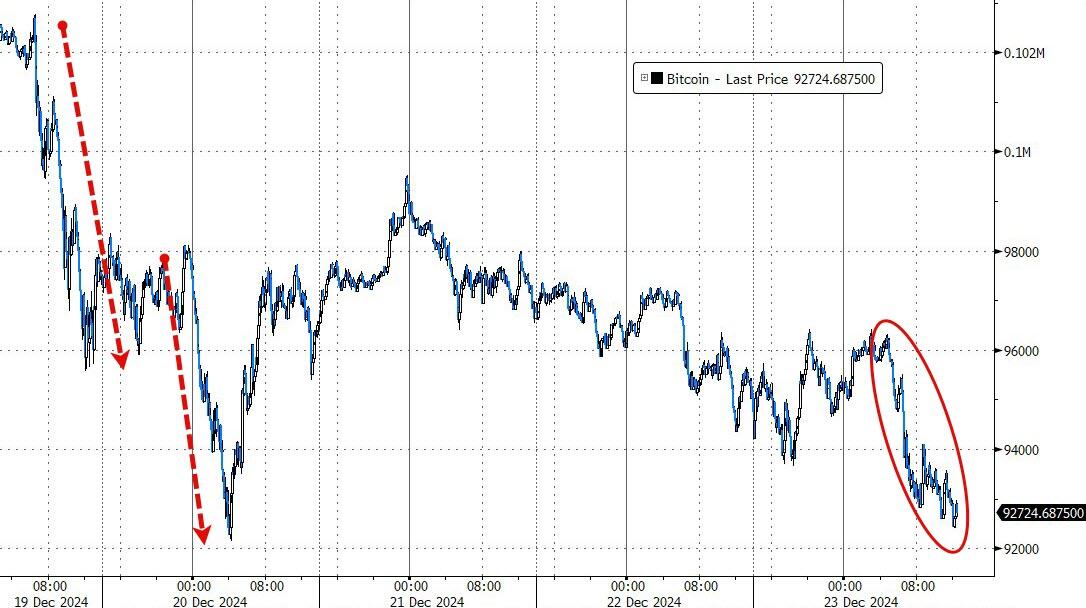
Mega-cap tech stocks took an early dive but rebounded thanks to dip buyers, nearly breaking even. Bitcoin followed a similar path, dropping early but staging a strong recovery to close in the green.

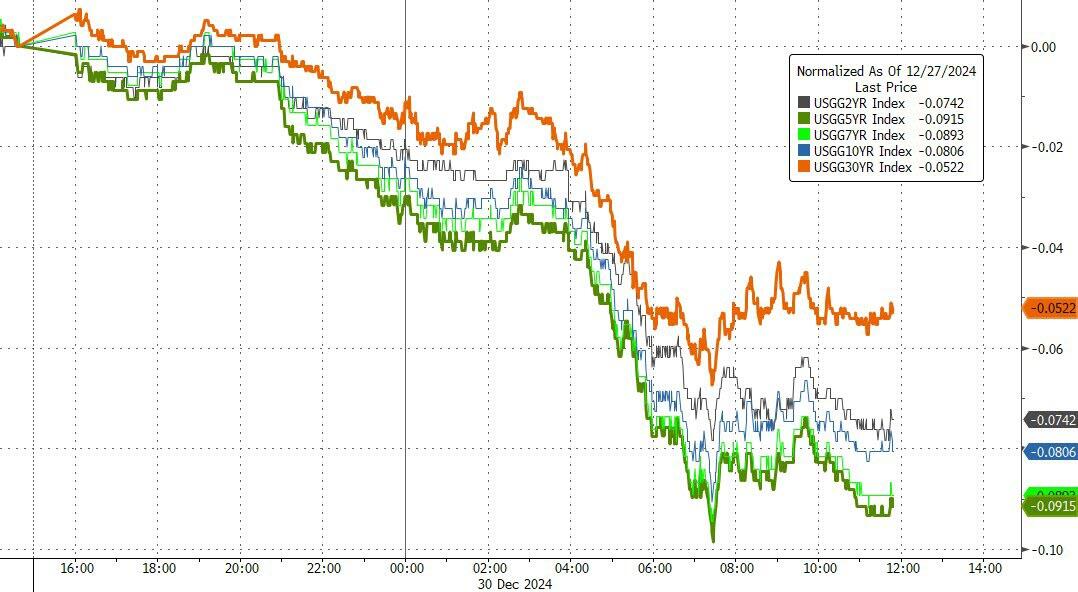
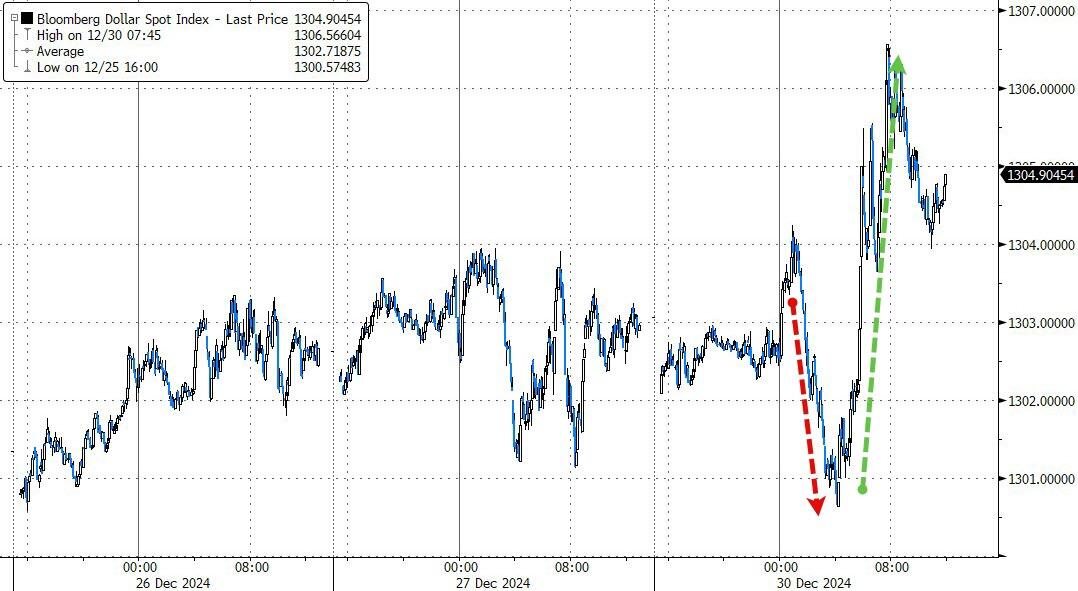
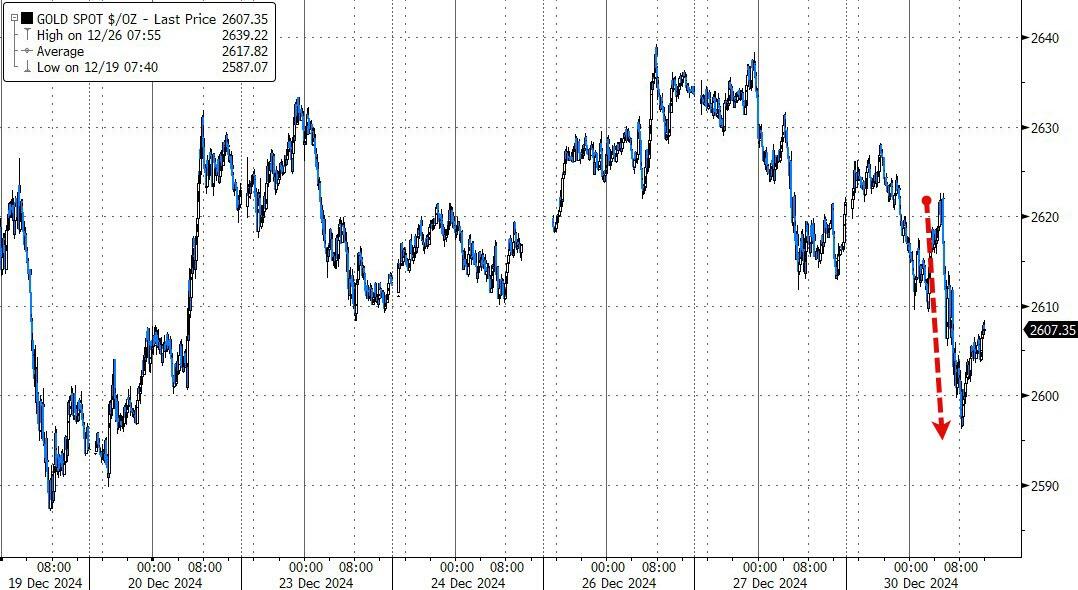
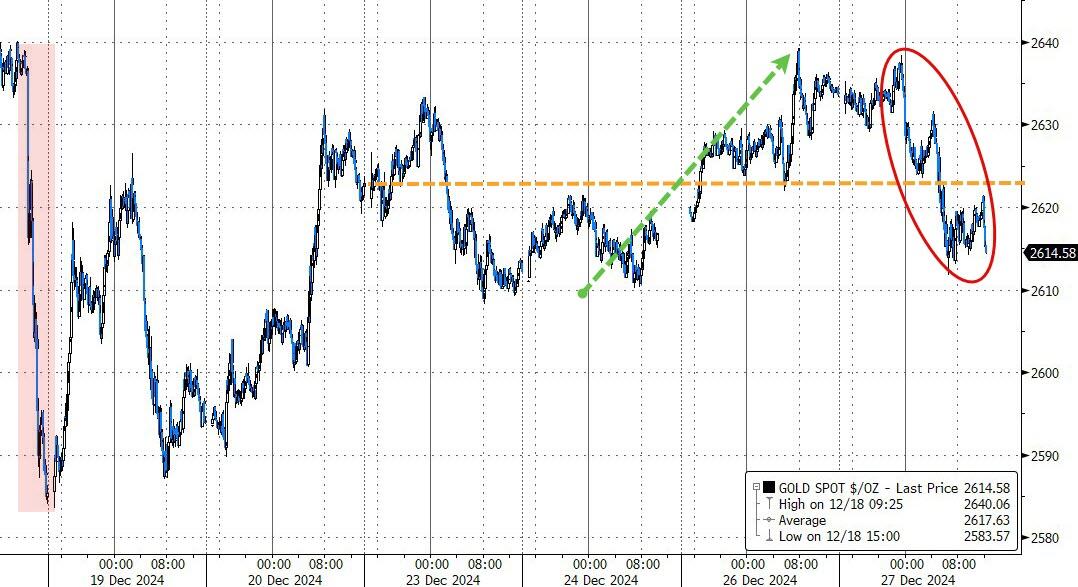
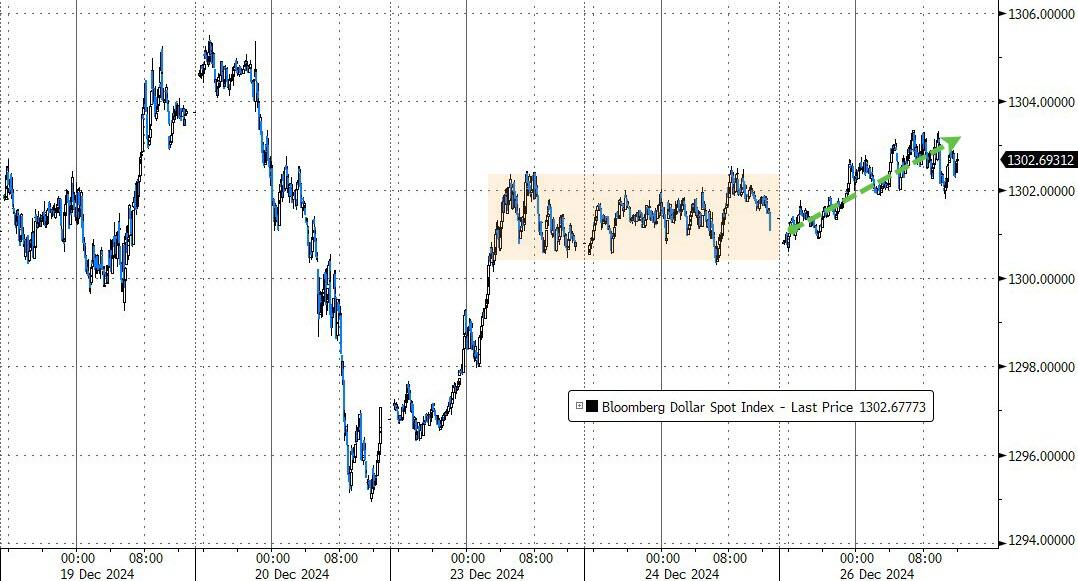
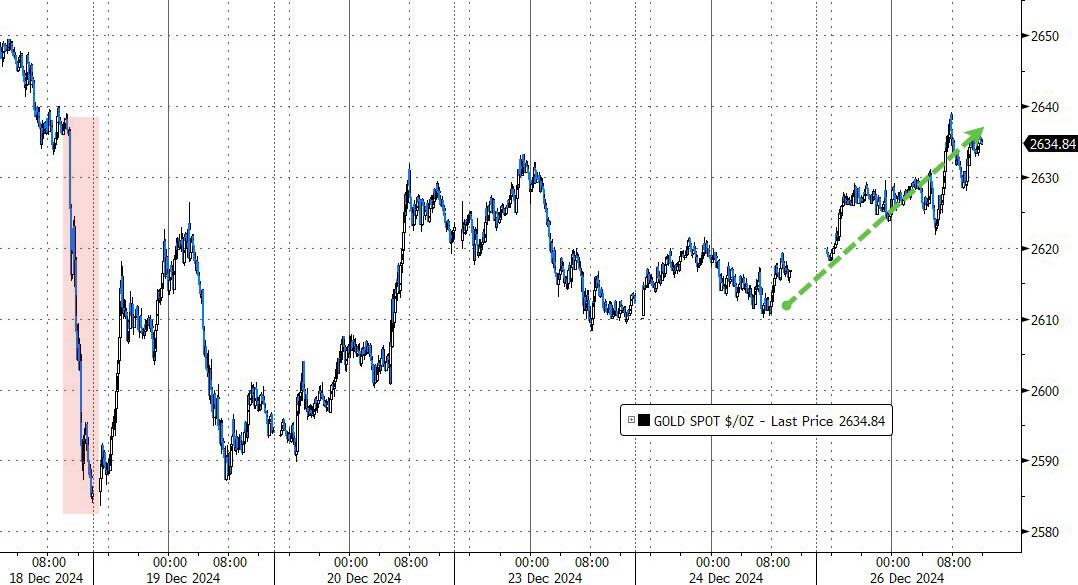
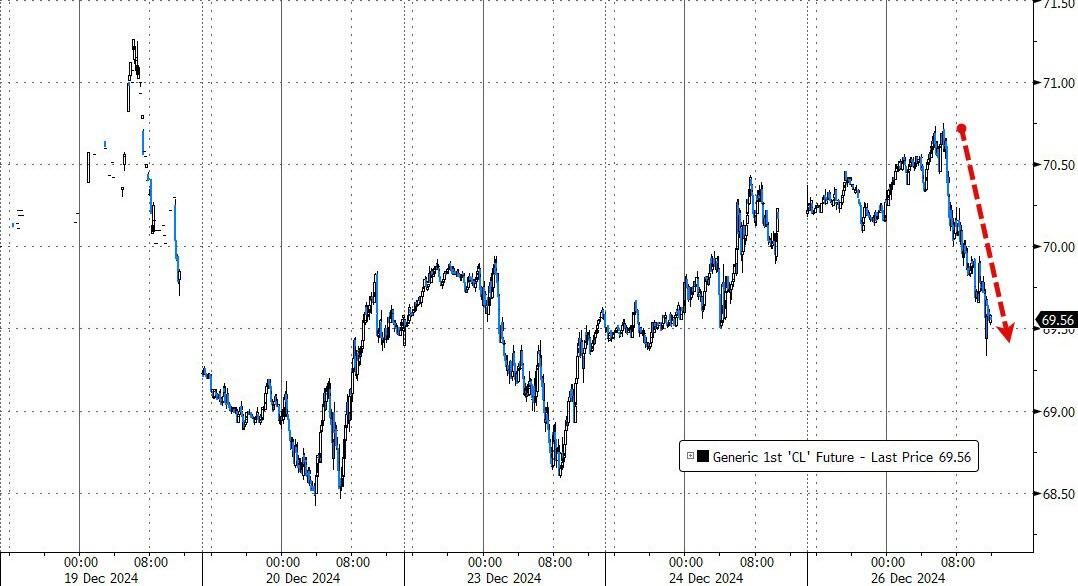
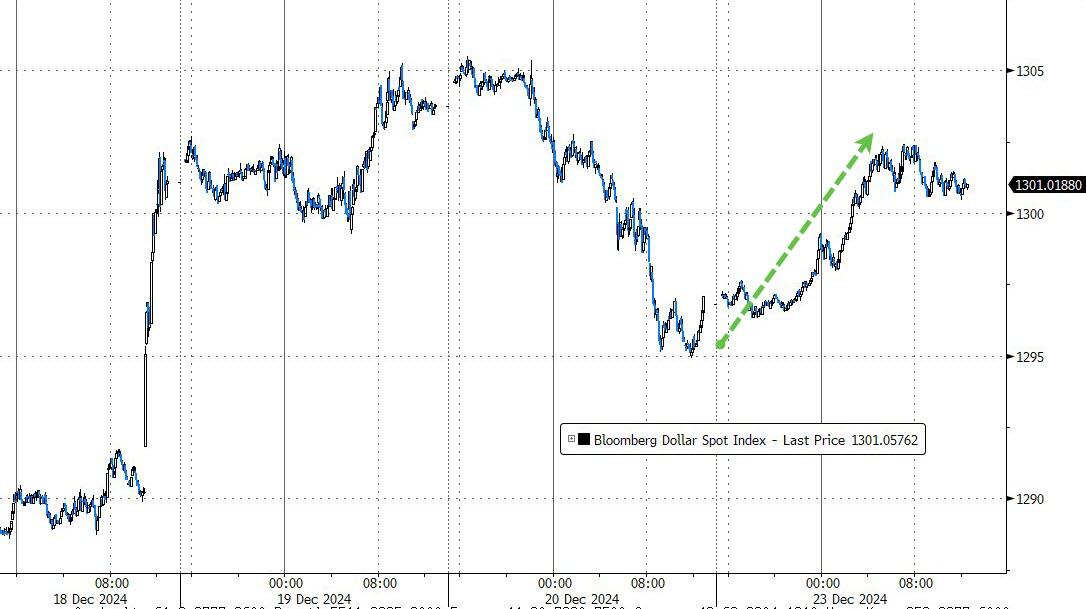
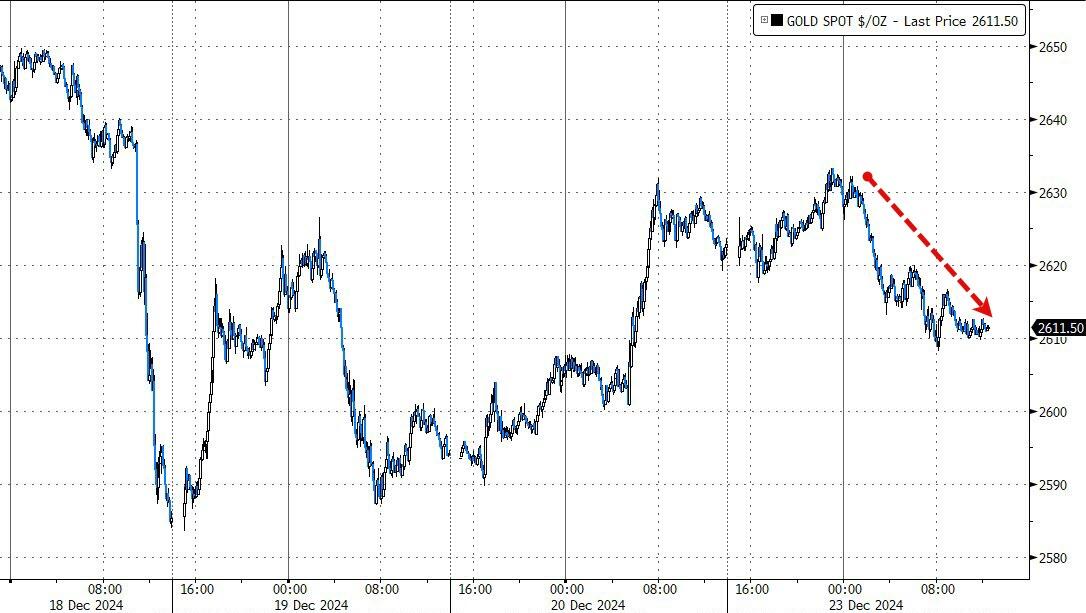
Bond yields finally fell, with the 10-year yield sliding to 4.54%, a small but encouraging improvement. The dollar also recovered from a significant drop, which ultimately cost gold a positive close.

As we approach the last trading day of the year, will the bulls find something to cheer about despite a lackluster December?

Read More

ETFs On The Cutline – Updated Through 12/27/2024

Ulli ETFs on the Cutline Contact

Do you want to know which ETFs are hot and which ones are not? Then you need my High-Volume ETF Cutline report. It tells you how close or far each of the 311 ETFs I follow is from its long-term trend line (39-week SMA). These are the ETFs that trade more than $5 million a day, so they are not some obscure funds that nobody cares about.

The report is split into two parts: The winners that are above their trend line (%M/A), and the losers that are below it. The yellow line is the line of shame that separates them. You can see how many ETFs are in each group and how they have changed since the last report (144 vs. 141 current).

Take a peek:

The HV ETF Master Cutline Report

If you are confused by some of the terms we use, don’t panic. I have a helpful Glossary of Terms for you.

If you want to learn more about the Cutline method and how it can make you rich (or at least less poor), read my original post here.

ETF Tracker Newsletter For December 27, 2024

Ulli ETF Tracker Contact

ETF Tracker StatSheet          

You can view the latest version here.

DISAPPOINTING MACRO DATA AND RISING YIELDS DRIVE MARKET SELL-OFF

[Chart courtesy of MarketWatch.com]

  1. Moving the market

On the final trading day of the holiday week, the major indexes suffered a pullback, with the Nasdaq leading the downturn.

Despite the S&P 500 achieving its best Christmas Eve performance since 1974, today’s correction reduced the index’s gain to less than 0.75% for this shortened holiday week. Nevertheless, traders remain optimistic that the so-called Santa Claus rally, which includes the last five trading days of the year and the first two of the new year, is still on track.

Month-to-date, the major indexes have shown significant divergence. The Nasdaq is up approximately 2%, while the S&P 500 has slipped into the red, and the Dow has declined by over 3%, marking its worst month since April.

Today’s sell-off was driven by several factors, including another week of disappointing US macroeconomic data, such as shrinking wholesale inventories, year-end rebalancing of pension funds, declining mega-cap stocks, and rising bond yields.

The dollar rallied this week, recovering most of last Friday’s drop. Gold slipped today but ended the four trading days unchanged, while Bitcoin fell below the $100,000 level.

Market confusion persists as traders grapple with the unusual situation where the Fed’s 1% reduction in interest rates has been accompanied by a corresponding 1% rise in bond yields.

Given these developments, I have to wonder: Has the Fed lost its credibility?

Read More

Weekly StatSheet For The ETF Tracker Newsletter – Updated Through 12/26/2024

Ulli ETF StatSheet Contact

ETF Data updated through Thursday, December 26, 2024

How to use this StatSheet:

  1. Out of the 1,800+ ETFs out there, I only pick the ones that trade over $5 million per day (HV ETFs), so you don’t get stuck with a lemon that nobody wants to buy or sell.
  1. Trend Tracking Indexes (TTIs)

These are the main indicators that tell you when to buy or sell Domestic and International ETFs (section 1 and 2). They do that by comparing their position to their long-term M/A (Moving Average). If they cross above, and stay there, it’s a green light to buy. If they fall below, and keep going, it’s a red light to sell. And to make sure you don’t lose your shirt if things go south, I also use a 12% trailing stop loss on all positions in these categories.

  1. All other investment areas don’t have a TTI and should be traded based on the position of each ETF relative to its own trend line (%M/A). That’s why I call them “Selective Buy.” In other words, if an ETF goes above its own trend line, you can buy it. But don’t forget to use a trailing sell stop of 12%, or less if you’re feeling nervous.

If some of these words sound like Greek to you, please check out the Glossary of Terms and new subscriber information in section 9.

  1. DOMESTIC EQUITY ETFs: BUY— since 11/21/2023

Click on chart to enlarge

This is our main compass, the Domestic Trend Tracking Index (TTI-green line in the above chart). It has broken above its long-term trend line (red) by +3.79% and is in “Buy” mode as posted.

Read More

Gold Gains Amid Market Declines; Bitcoin And Oil Fall

Ulli Market Commentary Contact

[Chart courtesy of MarketWatch.com]

  1. Moving the market

The major indexes went through moderate declines early in the session as the markets absorbed recent gains from the holiday week, commonly referred to as the Santa Claus rally.

This phenomenon typically occurs during the last five trading days of the year and the first two days of January. Historically, the S&P 500 has averaged a return of 1.3% during this period, significantly outperforming the market’s average return of 0.3%, according to LPL Research.

This rally is primarily driven by retail investors, as many institutional investors are not active during this time. Therefore, this positive period does not necessarily indicate what will happen in January and February.

In economic news, weekly jobless claims improved slightly from 225,000 to 219,000. However, continuing claims rose to 1.91 million, the highest level since November 2021, signaling potential economic weakness.

Today, the most shorted stocks saw a squeeze higher, but this was insufficient to keep the major indexes in positive territory after a midday rebound, except for Small Caps.

Bond yields fell after an early rise, and the dollar edged slightly higher. Gold defied the trend, gaining 0.71% on the day, while Bitcoin lost its Christmas Eve gains, joining crude oil, which fell back below $70.

With only three trading days left in the year, will the bulls be able to complete the Santa Claus rally?

Read More

Markets Rebound Strongly, Tech Sector Leads Gains

Ulli Market Commentary Contact

[Chart courtesy of MarketWatch.com]
  1. Moving the market

Despite an early dip, the markets quickly rebounded, with major indexes closing in the green and keeping hopes of a Santa Claus rally alive.

This solid recovery followed last week’s turmoil, during which the Dow endured a 10-day losing streak and plummeted over 1,100 points on Wednesday. This drop was triggered by the Federal Reserve’s announcement that fewer rate cuts would be planned for 2025 than previously anticipated.

Early in the day, weak economic data dampened sentiment, as the Consumer Confidence Index for December fell to 104.7, its lowest level since September and below the expected 113.

However, even worsening Economic Surprise data and softening survey data couldn’t hold back the bulls. The rebound continued, despite the low liquidity typical of the pre-Christmas period.

The tech sector led the day’s gains, with heavyweights Tesla, Meta, and Nvidia each adding at least 2%. Bond yields rose, the dollar recovered from Friday’s losses, and gold moved in the opposite direction. Bitcoin remained steady over the weekend but declined in today’s session.

Tomorrow will be a shortened session on Wall Street, and I won’t be providing a market commentary. However, I will return on Thursday to close out the week with the usual reports.

Merry Christmas!

Read More