ETF/No Load Fund Tracker Newsletter For February 6, 2015
ETF/No Load Fund Tracker StatSheet
————————————————————-
THE LINK TO OUR CURRENT ETF/MUTUAL FUND STATSHEET IS:
https://theetfbully.com/2015/02/weekly-statsheet-for-the-etfno-load-fund-tracker-newsletter-updated-through-02052015/
————————————————————
Market Commentary
Friday, February 6, 2015
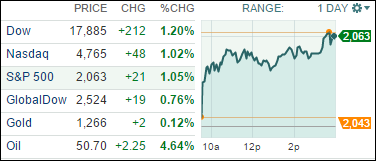
MARKETS SLOW DOWN TO END THE WEEK
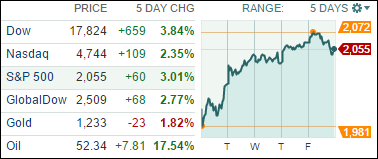
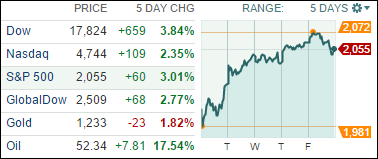
[Chart courtesy of MarketWatch.com]
1. Moving the Markets
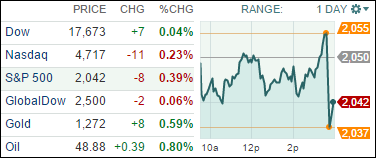
Stocks lost steam Friday, despite the Labor Department showing data of an improving job market. The S&P 500 moved back into the red (once again) for 2015.
With stocks sluggish in early trading today, investors appeared to be weighing that good news from the Labor Department with the nearing prospect of Fed rate hikes. Then about an hour before the 4 p.m. ET close came news that Greece faces a tight deadline of submitting a new bailout plan. The ECB wants to see Greece’s blueprint of dealing with its crippling debt by Feb. 16. Markets subsequently slipped back into the red thereafter.
Here in the U.S., Paul Ashworth, chief U.S. economist at Capital Economics, said the Fed’s first rate hike is nearing and that the central bank will likely be less patient before pulling the trigger.
In further economic news, consumers increased their borrowing in December, according to reports that credit card expenses rose at the fastest pace in eight months. This could potentially be a good sign that consumer spending will accelerate if strong jobs growth continues. Consumer debt now stands at $3.31 trillion, the Federal Reserve reported Friday.
9 our 10 ETFs in the Spotlight slid today as the markets ended a great up week on a sour note. 9 of them are showing green YTD.
2. ETFs in the Spotlight
In case you missed the announcement and description of this section, you can read it here again.
It features 10 broadly diversified ETFs from my HighVolume list as posted every Monday. Furthermore, they are screened for the lowest MaxDD% number meaning they have been showing better resistance to temporary sell offs than all others over the past year.
Here are the 10 candidates:
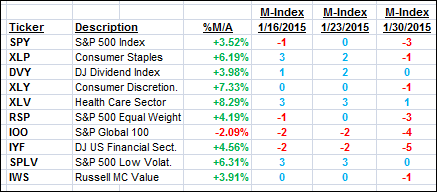
The above table simply demonstrates the magnitude with which some of the ETFs are fluctuating in regards to their positions above or below their respective individual trend lines (%M/A). A break below, represented by a negative number, shows weakness, while a break above, represented by a positive percentage, shows strength.
For hundreds of ETF/Mutual fund choices, be sure to reference Thursday’s StatSheet.
Year to date, here’s how the above candidates have fared so far:
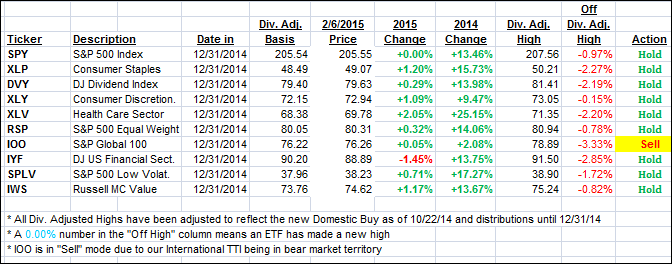
Again, the first table above shows the position of the various ETFs in relation to their respective long term trend lines (%M/A), while the second one tracks their trailing sell stops in the “Off High” column. The “Action” column will signal a “Sell” once the -7.5% point has been taken out in the “Off High” column.
3. Trend Tracking Indexes (TTIs)
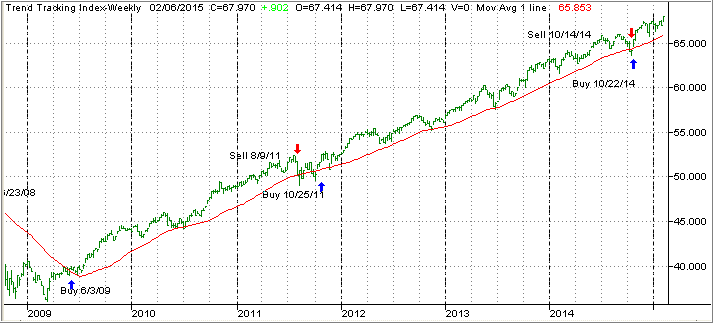
Our Trend Tracking Indexes (TTIs) joined the trend reversal and headed deeper into bullish territory. Especially the International one recovered nicely, and we are staring a new “Buy” signal in the face, which may be generated as soon as next week.
Here’s how this week ended:
Domestic TTI: +2.77% (last Friday +2.02%)—Buy signal since 10/22/2014
International TTI: +0.89% (last Friday -0.97%)—Sell signal effective 12/15/14
Have a nice weekend.
Ulli…
Disclosure: I am obliged to inform you that I, as well as advisory clients of mine, own some of these listed ETFs. Furthermore, they do not represent a specific investment recommendation for you, they merely show which ETFs from the universe I track are falling within the guidelines specified.
————————————————————-
READER Q & A FOR THE WEEK
All Reader Q & A’s are listed at our web site!
Check it out at:
http://www.successful-investment.com/q&a.php
Reader Nicholas:
Q: Ulli: I have been through the material on your site, though not through every blog post, so my apologies if you have answered these questions previously…
I understand the basis on which you rank ETF and mutual funds, your sell stop process and re-entry process. The part I am struggling with is how you select which ETF/mutual fund to buy; do you just buy – say the top three? Or do you have some secondary selection process? I appreciate that each investor/client may have different criteria, but it would be helpful if you could outline that stage of your process.
Secondly, do you worry about diversification across sectors – i.e. say you have two China ETF/funds, would you buy only one? And how many investments would you have in say a $300k portfolio to give a spread across several sectors/areas? I know I read somewhere that with new funds to invest, you tend to get 50% into the market and then invest over the next few months; I just wondered how many investments you typically hold in client portfolios?
Third, do you have a “sell waiting time”- i.e. if an ETF/Fund does not advance and therefore drops down the league table, do you have a cut off time/ranking when you sell and invest in an ETF with a higher ranking.
Finally, what are your thoughts about investing at this stage in the market cycle (Jan 2015); the bull market is long in the tooth, but many fund managers have been waiting for a significant correction to invest as shown by the spike in October; i.e. there may well be money to support another move higher.
Equally while many pundits are calling the market “weak and unsupported”, the soft economic policies on both sides of the Atlantic are likely to continue to support/inflate the markets further.
Once again I appreciate your commonsense approach to investing – just nervous about investing at this stage in the market.
A: Nicholas: Let me address your questions as follows:
1. In regards to the rankings and which funds to buy, I personally prefer not being exposed to the top performers as they tend to correct the most when markets retreat and cause more whip-saw signals than I like. So, from the StatSheet, I drop down from the top and usually make a middle of the road selection. I have improved on that process by featuring daily updates of the 10 ETFs in the Spotlight that have been selected due to their favorable criteria. If you missed the announcement, you can again read it here.
2. I have found that most investors over diversify. The most extreme example happened a few years ago when a prospective client had me review his portfolio, which consisted of $50,000 invested in 35 mutual funds!
As I have written in my e-book, “How to beat the S&P 500…with the S&P 500,” you can manage an entire portfolio with just SPY. In my advisor practice, a $300k account would currently be invested in 3 ETFs; that could change depending on market conditions. To do so conservatively, you may want to consider my incremental buying procedure, which is presented in this video.
3. There is always some sector rotation going on as the markets bob and weave. I observe the ETF performance of my holdings constantly but only make a change if one them is severely lacking while the others are sprinting ahead. I might give it 3 months or so and then decide whether it’s time to “upgrade” and dump the loser.
Sure, predictions abound as to what the markets will do next, although it’s nothing but a wild guessing game since no one actually has a crystal ball. That is with the exception of the Fed, who can by shear public jawboning change market direction in a second. Having said that, that’s what makes the use of Trend Tracking such a comfortable investment choice, since we don’t care who or what moves markets; we are OK with the fact that we have an exit strategy in place that we can rely on and that has the potential to control our downside risk should the bear strike again.
You sound very hesitant when it comes to entering the markets, and I can’t blame you. To me, there are 2 choices that might make sense for you at this time. If you don’t like the environment we’re in, simply don’t invest! Alternatively, if you want to participate but having trouble making a decision, consider using our managed account service. That would take the emotional decision making out of play and you can be comfortable in the thought that all will be executed according to plan.
———————————————————-
WOULD YOU LIKE TO HAVE YOUR INVESTMENTS PROFESSIONALLY MANAGED?
Do you have the time to follow our investment plans yourself? If you are a busy professional who would like to have his portfolio managed using our methodology, please contact me directly or get more details at:
https://theetfbully.com/personal-investment-management/
———————————————————
Back issues of the ETF/No Load Fund Tracker are available on the web at:
https://theetfbully.com/newsletter-archives/

 ValueShares, the Broomall, Philadelphia-based exchange traded fund issuing-arm of money-management firm Alpha Architect LLC recently launched the international version of its earlier US-focused “quantitative value” ETF.