Going Nowhere

Ulli Market Commentary Contact

Mon pic

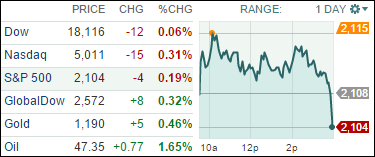
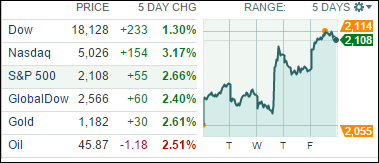
[Chart courtesy of MarketWatch.com]

1. Moving the Markets

The indexes meandered throughout the trading day but were not able to sustain early upside momentum. In the last few minutes of trading, the indexes puked and finished in the red, although by only a small margin given last week’s advance.

Concern remained in the currency arena where the dollars advance has raised serious concerns about future profitability of those companies with international exposure. Even though there was some dollar pullback today, stocks did not get any support out of it.

A host of economic data is on the menu for this week, but most closely watched will be the release of the GDPs’ fourth quarter revisions coming up this Friday.

7 of our 10 ETFs in the Spotlight slipped while 3 advanced. Heading the gainers was Global 100 (IOO) with +0.38%, while the downside was lead by Financials, which gave up -0.43%.

Read More

ETFs/Mutual Funds On The Cutline – Updated Through 03/20/2015

Ulli ETFs on the Cutline Contact

Below are the latest ETF Cutline reports, which show how far above or below their respective long-term trend lines (39 week SMA) my currently tracked ETFs/MFs are positioned.

The first report covers the ETF Master List from Thursday’s StatSheet and includes 410 ETFs, of which currently 292 (last week 237) are hovering in bullish territory.

The second report includes only High Volume ETFs. To clarify, High Volume (HV) ETFs are defined as those with an average daily volume of $10 million or higher.

These ETFs are generated from my selected list of some 97 that I use in my advisor practice. It cuts out the “noise,” which simply means it eliminates those ETFs that I would never buy because of their volume limitations. 48 ETFs (last week 37) have managed to remain in bullish territory after the recent market volatility.

The third report covers Mutual Funds on the Cutline. There are currently 520 (last week 352) above the line and 300 below it out of the 820 that I follow.

Take a look:

1. ETF Master Cutline Report

2. ETF High Volume Cutline Report

3. MF Cutline Report

In case you are not familiar with some of the terminology used in the reports, please read the Glossary of Terms.

If you missed the original post about the Cutline approach, you can read it here.

One Man’s Opinion: Will Weak Oil Prices Keep Inflation Expectations Subdued?

Ulli Market Review Contact

92835431The US Federal Reserve’s latest policy statement may have omitted the “patient” word, but there seems to be less certainty in the central bank’s overall tone, indicating the Fed wants to be less predictable about a June rate-hike given the multitude of data that is affecting the US economy, said Matthew Beesley, head of global equities at Henderson Global Investors.

Fed chair Janet Yellen is very keen to ensure there’s no supposedly “Yellen Put” factored in by the markets and there’s no free-ride for investors in the US. Since the US equity markets are at record high, there’s clearly this fear about the price levels of asset classes when interest rates start to rise eventually.

The Fed is trying to send the message that it would move responsibly when things start to change; it wouldn’t be just a dogmatic move when rates rise simply because that’s how they used to be in the past.

Read More

New ETFs On The Block: SPDR S&P 500 Buyback ETF (SPYB)

Ulli Equity ETFs Contact

98153895The US economy is facing a strange situation; while corporate profits reached record highs, economic activity still remains subdued along with considerable slack in capacity utilization.

In the absence of capex opportunities, many companies are undertaking share buybacks to trim balance-sheets and boost EPS/returns. Also, buybacks are more tax efficient for investors than a special dividend.

Data by FactSet shows buybacks by S&P 500 companies rose to $143.4 billion in the third quarter of 2014, the fourth highest since 2005. Further, about 374 companies of the benchmark index repurchased some of their own shares between July and September last year, the report showed.

Read More

03-20-2015

Ulli Newsletter Archives Contact

ETF/No Load Fund Tracker Newsletter For March 20, 2015

ETF/No Load Fund Tracker StatSheet

————————————————————-

THE LINK TO OUR CURRENT ETF/MUTUAL FUND STATSHEET IS:

https://theetfbully.com/2015/03/weekly-statsheet-for-the-etfno-load-fund-tracker-newsletter-updated-through-03192015/

————————————————————

Market Commentary

Friday, March 20, 2015

STOCKS CLOSE VOLATILE WEEK ON POSITIVE NOTE
Fri pic

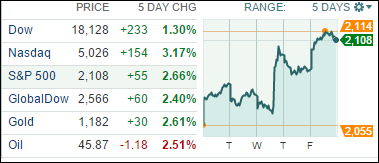
[Chart courtesy of MarketWatch.com]

1. Moving the Markets

It was a volatile week of trading, but U.S. stocks capped off Friday in positive territory lifted by a positive slew of corporate news.

Nike (NKE) announced earnings results that topped analyst forecasts due to increased demand in both North America and China. The stock now sits at a price of $101.98 and is up about 6.06% YTD.

There was big news in the world of pharmaceuticals today. A number of analysts raised their price target on Biogen Idec Inc. (BIIB) after the company’s phase 1 study results for Alzheimer’s treatment were released. According to a number of news reports, the results of the Phase 1 study were better than expected. Shares gained about 7% to close at a price of $463.22.

On the week, stocks moved higher overall. Much of the upside was sparked by Wednesday’s comments from the Fed that an interest rate hike in April remains unlikely. The word “patient” was no longer the buzz word in their statements, however. In the broader U.S. economy, trends allegedly continue to support expectations for more economic growth despite continuously disappointing macro data.

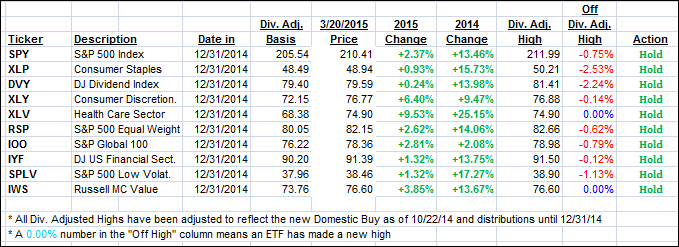
All of our 10 ETFs in the Spotlight marched higher today with the Global S&P 500 (IOO) leading at +1.46% while Healthcare (XLV) lagged with +0.73% but managed to make a new yearly high.

All ETFs are now positive for the year as the table in section 2 below shows.

2. ETFs in the Spotlight

In case you missed the announcement and description of this section, you can read it here again.

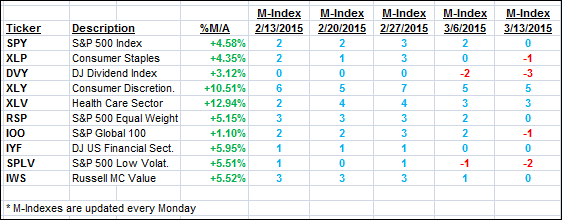
It features 10 broadly diversified ETFs from my HighVolume list as posted every Monday. Furthermore, they are screened for the lowest MaxDD% number meaning they have been showing better resistance to temporary sell offs than all others over the past year.

Here are the 10 candidates:
MaxDD

The above table simply demonstrates the magnitude with which some of the ETFs are fluctuating in regards to their positions above or below their respective individual trend lines (%M/A). A break below, represented by a negative number, shows weakness, while a break above, represented by a positive percentage, shows strength.

For hundreds of ETF/Mutual fund choices, be sure to reference Thursday’s StatSheet.

Year to date, here’s how the above candidates have fared so far:
YTD

Again, the first table above shows the position of the various ETFs in relation to their respective long term trend lines (%M/A), while the second one tracks their trailing sell stops in the “Off High” column. The “Action” column will signal a “Sell” once the -7.5% point has been taken out in the “Off High” column.

3. Trend Tracking Indexes (TTIs)

Our Trend Tracking Indexes (TTIs) rallied sharply during this extremely volatile week and moved deeper into bullish territory.

Here’s how we closed:

Domestic TTI: +4.07% (last Friday +2.47%)—Buy signal effective 10/22/2014

International TTI: +4.98% (last Friday +1.98%)—Buy signal effective 2/13/2015

Have a nice weekend.

Ulli…

Disclosure: I am obliged to inform you that I, as well as advisory clients of mine, own some of these listed ETFs. Furthermore, they do not represent a specific investment recommendation for you, they merely show which ETFs from the universe I track are falling within the guidelines specified.

————————————————————-

READER Q & A FOR THE WEEK

All Reader Q & A’s are listed at our web site!
Check it out at:

http://www.successful-investment.com/q&a.php

Reader Bob:

Q: Ulli: I want to thank you for giving us your postings freely. I have been a follower since 2009 when you had the model portfolios.

We got yanked around when it was a traders market and you gave that up and went to posting the ETF listings. I use your momentum index for buy and sell and the TTI for IN and Out criteria. Do you have any desire of starting fund portfolios up again? Thanks again!

A: Bob: Thanks for your kind words. No, I have no intention of starting the model portfolios again. The 10 ETFs in the Spotlight offer far better choices and have proved to be superior in terms of performance. I have recently added the M-Index for the latest 5 weeks, so you can quickly identify which of the 10 is demonstrating better or worse momentum.

———————————————————-

WOULD YOU LIKE TO HAVE YOUR INVESTMENTS PROFESSIONALLY MANAGED?

Do you have the time to follow our investment plans yourself? If you are a busy professional who would like to have his portfolio managed using our methodology, please contact me directly or get more details at:

https://theetfbully.com/personal-investment-management/

———————————————————

Back issues of the ETF/No Load Fund Tracker are available on the web at:

https://theetfbully.com/newsletter-archives/

ETF/No Load Fund Tracker Newsletter For March 20, 2015

Ulli ETF Tracker Contact

ETF/No Load Fund Tracker StatSheet

————————————————————-

THE LINK TO OUR CURRENT ETF/MUTUAL FUND STATSHEET IS:

https://theetfbully.com/2015/03/weekly-statsheet-for-the-etfno-load-fund-tracker-newsletter-updated-through-03192015/

————————————————————

Market Commentary

Friday, March 20, 2015

STOCKS CLOSE VOLATILE WEEK ON POSITIVE NOTE

Fri pic

[Chart courtesy of MarketWatch.com]

1. Moving the Markets

It was a volatile week of trading, but U.S. stocks capped off Friday in positive territory lifted by a positive slew of corporate news.

Nike (NKE) announced earnings results that topped analyst forecasts due to increased demand in both North America and China. The stock now sits at a price of $101.98 and is up about 6.06% YTD.

There was big news in the world of pharmaceuticals today. A number of analysts raised their price target on Biogen Idec Inc. (BIIB) after the company’s phase 1 study results for Alzheimer’s treatment were released. According to a number of news reports, the results of the Phase 1 study were better than expected. Shares gained about 7% to close at a price of $463.22.

On the week, stocks moved higher overall. Much of the upside was sparked by Wednesday’s comments from the Fed that an interest rate hike in April remains unlikely. The word “patient” was no longer the buzz word in their statements, however. In the broader U.S. economy, trends allegedly continue to support expectations for more economic growth despite continuously disappointing macro data.

All of our 10 ETFs in the Spotlight marched higher today with the Global S&P 500 (IOO) leading at +1.46% while Healthcare (XLV) lagged with +0.73% but managed to make a new yearly high.

All ETFs are now positive for the year as the table in section 2 below shows.

Read More