ETF/No Load Fund Tracker Newsletter For January 30, 2015
ETF/No Load Fund Tracker StatSheet
————————————————————-
THE LINK TO OUR CURRENT ETF/MUTUAL FUND STATSHEET IS:
https://theetfbully.com/2015/01/weekly-statsheet-for-the-etfno-load-fund-tracker-newsletter-updated-through-01292015/
————————————————————
Market Commentary
Friday, January 30, 2015
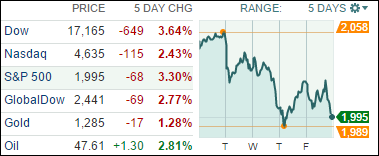
A DISAPPOINTING END TO A DISAPPOINTING MONTH…AGAIN
[Chart courtesy of MarketWatch.com]
1. Moving the Markets
Despite being one of the best performing equity markets in 2014, the S&P 500 is off to a choppy and sluggish start to 2015. Slow growth and deflation pressure in Europe have led to more aggressive central bank (ECB) stimulus, while alleged stronger growth prospects in the U.S. may demand a shift in Fed policy in the second half of 2015.
To recap the first month of trading, January finished 3.1% lower, similar to the 3.6% decline we saw in 2014. While we all know the saying “as January goes, so goes the year,” those that left the market after the decline in January 2014 would have missed a 15.5% gain in February through December. In fact, since 1950, a negative return in January accurately predicted negative returns for the year about 50% of the time – basically a coin flip. No one can predict what the markets will do. So, I think the lesson here is, let long-term trends dictate investment decisions, not catchy sayings.
Looking to next week and a fresh month of trading and economic data, we will receive an employment report on Friday. The expectations are for more than 200,000 job additions for the 12th consecutive month. Economists expect 230,000 jobs to have been added in January, and for the unemployment rate to stay at 5.7%. Other reports include the ISM manufacturing and non-manufacturing indexes, personal income and spending, and auto sales.
All of our 10 ETFs in the Spotlight headed south today and only one is showing green numbers for the year. Take a look at the table in section 2.
2. ETFs in the Spotlight
In case you missed the announcement and description of this section, you can read it here again.
It features 10 broadly diversified ETFs from my HighVolume list as posted every Monday. Furthermore, they are screened for the lowest MaxDD% number meaning they have been showing better resistance to temporary sell offs than all others over the past year.
Here are the 10 candidates:
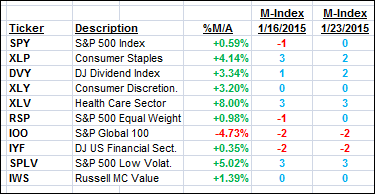
The above table simply demonstrates the magnitude with which some of the ETFs are fluctuating in regards to their positions above or below their respective individual trend lines (%M/A). A break below, represented by a negative number, shows weakness, while a break above, represented by a positive percentage, shows strength.
For hundreds of ETF/Mutual fund choices, be sure to reference Thursday’s StatSheet.
Year to date, here’s how the above candidates have fared so far:
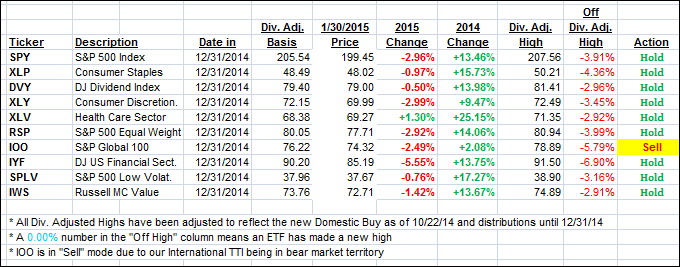
Again, the first table above shows the position of the various ETFs in relation to their respective long term trend lines (%M/A), while the second one tracks their trailing sell stops in the “Off High” column. The “Action” column will signal a “Sell” once the -7.5% point has been taken out in the “Off High” column.
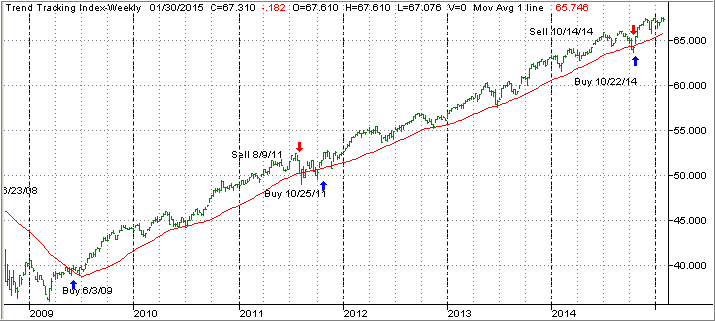
3. Trend Tracking Indexes (TTIs)
Our Trend Tracking Indexes (TTIs) suffered from this week’s market slide and headed south. While the Domestic one remains on the bullish side, the International one dipped deeper into bearish territory.
Here’s how this week ended:
Domestic TTI: +2.02% (last Friday +2.81%)—Buy signal since 10/22/2014
International TTI: -0.97% (last Friday -0.47%)—Sell signal effective 12/15/14
Have a nice weekend.
Ulli…
Disclosure: I am obliged to inform you that I, as well as advisory clients of mine, own some of these listed ETFs. Furthermore, they do not represent a specific investment recommendation for you, they merely show which ETFs from the universe I track are falling within the guidelines specified.
————————————————————-
READER Q & A FOR THE WEEK
All Reader Q & A’s are listed at our web site!
Check it out at:
http://www.successful-investment.com/q&a.php
Reader Marty:
Q: Ulli: I join the chorus of your many subscribers and give you hearty thanks for the work you do and the wealth of information you provide to help us be more successful investors.
An extra thank you is deserved for providing this information for free!
When the markets turn negative, as they are certain to do, is there any point where you would consider taking a position in one or more of the many inverse ETFs to continue capturing a gain even while the markets continue to decline?
Fleeing to money market funds, with their current pitiful yields, will be actually a losing position because of inflation and other factors.
Are there ETFs that can provide a decent return without completely losing much of our capital position?
Keep up the great work.
A: Marty: Thanks for your kind words…
The first move, once the Domestic Trend Tracking Index (TTI) breaks below its long-term trend line indicating an upcoming bear market, is to the safety of the money market funds, as markets tend to get extremely volatile during a severe correction.
Then we can evaluate, without being emotionally attached, if there are any asset classes, such as bond ETFs, which are rallying despite the equity meltdown. If that’s the case, we may get invested in those areas. If things look uncertain, we will remain safely on the sidelines until the fog clears.
Alternatively, once the bear appears to have settled in, and we’ve seen no major bullish spikes, I may consider the short S&P 500 ETF (SH) and ease into the market with a small percentage at first. In that case, I will use the same trailing sell stop discipline that we use on the bullish side.
I am not a friend of leveraged inverse ETFs, as they tend to be too volatile for my risk tolerance.
———————————————————-
WOULD YOU LIKE TO HAVE YOUR INVESTMENTS PROFESSIONALLY MANAGED?
Do you have the time to follow our investment plans yourself? If you are a busy professional who would like to have his portfolio managed using our methodology, please contact me directly or get more details at:
https://theetfbully.com/personal-investment-management/
———————————————————
Back issues of the ETF/No Load Fund Tracker are available on the web at:
https://theetfbully.com/newsletter-archives/