Rallying Into The Close

Ulli Market Commentary Contact

Mon pic

[Chart courtesy of MarketWatch.com]

1. Moving the Markets

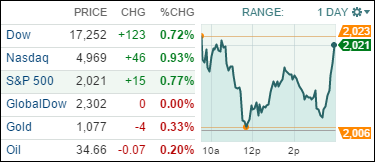
Oil prices headed south again but investors did not care as domestic indexes were mixed early on but suddenly rallied into the close as choppiness prevailed. There was no news event supporting the sudden intra-day trend reversal as energy showed continued weakness and European markets suffered a severe sell-off.

With the volatility of recent days it’s hard to read anything into these bounces other than seasonality, but with volume slowing more choppiness is sure to be in the cards for the remainder of this year. However, I doubt as to whether meaningful upward momentum can turn into the now overdue but still longed for Santa Claus rally.

9 of our 10 ETFs in the Spotlight edged higher with Consumer Staples (XLP) as the front runner (+1.09%) and the Global 100 (IOO) as the laggard (-0.47%).

Read More

ETFs/Mutual Funds On The Cutline – Updated Through 12/18/2015

Ulli ETFs on the Cutline Contact

Below are the latest ETF Cutline reports, which show how far above or below their respective long-term trend lines (39 week SMA) my currently tracked ETFs/MFs are positioned.

The first report covers the ETF Master List from Thursday’s StatSheet and includes 381 ETFs, of which currently 35 (last week 36) are hovering in bullish territory.

The second report includes only High Volume ETFs. To clarify, High Volume (HV) ETFs are defined as those with an average daily volume of $10 million or higher. Volume figures can change in a hurry, so be sure to check first before investing.

These ETFs are generated from my selected list of 98 that I use in my advisor practice. It cuts out the “noise,” which simply means it eliminates those ETFs that I would never buy because of their volume limitations. 10 ETFs (last week 10) have managed to remain in bullish territory after the recent market volatility.

The third report covers Mutual Funds on the Cutline. There are currently 48 (last week 56) above the line and 752 below it out of the 800 that I follow.

Take a look:

  1. ETF Master Cutline Report
  2. ETF High Volume Cutline Report
  3. MF Cutline Report

In case you are not familiar with some of the terminology used in the reports, please read the Glossary of Terms.

If you missed the original post about the Cutline approach, you can read it here.

One Man’s Opinion: Will Junk Bond Defaults Go Up If Oil Remains At Current Levels?

Ulli Market Review Contact

ManThe US economy would certainly not witness a 2008-style recession despite the recent sell-out in the junk-bond market, said Jeffery Gundlach, co-founder and CEO of DoubleLine Capital.

The crises that started in 2008 are rare and seldom repeat themselves. It was probably and hopefully an once-in-a-lifetime event. Nevertheless, the condition in the junk-bond market is disconcerting though, but it’s really centered on commodity prices as opposed to financial leverage, which was the case in 2008.

Low commodity and oil prices are problematic for the junk-bond market because there’s a substantial fraction that is associated with materials, mining and energy. Increasingly, as oil stays where it is now, investors will find junk-bond markets populated with greater shares of these types of sub-sectors because the investment-grade bonds that were rated BBB are likely to get downgraded.

Read More

New ETFs On The Block: PowerShares S&P 500 Momentum Portfolio (SPMO)

Ulli Equity ETFs Contact

Financial DataFactor-based investing has been quite popular within the investment community and, at a time when valuations seem a little stretched, momentum factor based strategies managed to find increasing favor with investors.
PowerShares, the fourth-largest US issuer of exchange-traded funds and one of the biggest purveyors of factor-based investment, recently added a momentum factor based ETF to their lineup after the firm’s fairly successful previous products such as the PowerShares DWA Tactical Sector Rotation Portfolio (DWTR) and the PowerShares S&P 500 Low Volatility Portfolio (SPLV).

The newly minted PowerShares S&P 500 Momentum Portfolio (SPMO) tracks the performance of the S&P 500 Momentum Index and generally invests at least 90 percent of its total assets in stocks that are constituents of the index. The index consists of 101 stocks that have the highest momentum score from the broader S&P 500 universe.

Read More

ETF/No Load Fund Tracker Newsletter For December 18, 2015

Ulli Market Commentary Contact

ETF/No Load Fund Tracker StatSheet

————————————————————-

THE LINK TO OUR CURRENT ETF/MUTUAL FUND STATSHEET IS:

https://theetfbully.com/2015/12/weekly-statsheet-for-the-etfno-load-fund-tracker-newsletter-updated-through-12172015/

————————————————————

Market Commentary

EQUITIES GET SPANKED BY SLIDING CRUDE PRICES AND OPTIONS EXPIRY

 Fri pic

 [Chart courtesy of MarketWatch.com]

1. Moving the Markets

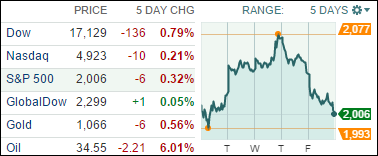
One look at the above chart tells the story. The euphoric “Fed High” did not last, the morning after hangover sat it in and the major indexes took a steep dive over the past 2 days closing the week lower but not by much. The S&P and Dow had their worst 2-day performance since September 1.

The culprits to this week’s debacle were the usual suspects: The continued swoon of oil prices, what the Fed’s announcement really means, a weakening global economy and the event du jour was quadruple options expiration day. The chart definitely resembles a black diamond slope with the indexes closing at their lowest point of the day, which may not bode well for Monday’s opening.

With the holidays upon us, I expect volume to slow down, and it remains to be seen if that might contribute to a Santa Claus rally next week.

All of our 10 ETFs in the Spotlight headed south as equities got hammered. The surprising leader to the downside was the conservative Consumer Staples ETF (XLP) with -2.49%, while the Mid-Cap Value (IWS) was the best performer with a loss of “only” -1.48%.

Our bearish outlook was confirmed again, as section 3 below shows, and a 100% cash position is my preferred choice.

Read More

Weekly StatSheet For The ETF/No Load Fund Tracker Newsletter – Updated Through 12/17/2015

Ulli ETF StatSheet Contact

ETF/Mutual Fund Data updated through Thursday, December 17, 2015

TOC 111915

If you are not familiar with some of the terminology used, please see the Glossary of Terms.


1. DOMESTIC EQUITY MUTUAL FUNDS/ETFs: SELL — since 11/13/2015

TTI

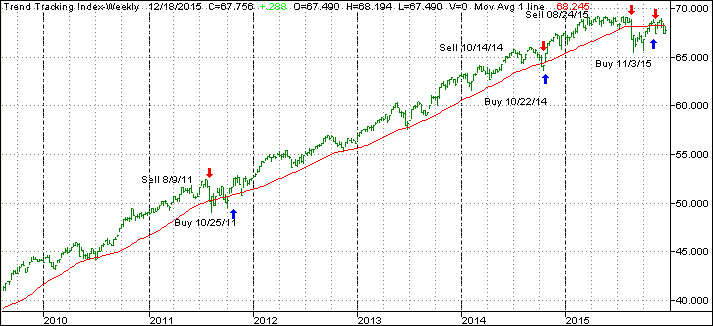
Our main directional indicator, the Domestic Trend Tracking Index (TTI-green line in above chart) has recently crawled above its long term trend line (red) and finally generated a new “Buy” signal effective 11/3/15. The market subsequently dropped, and we exited again on 11/13/15. As of today, the TTI remains below its trend line by -0.77%, which means we are in cash on the sidelines.

Read More