The major indexes attempted an early relief rally, but conflicting economic data and uncertainty over Trump’s tariffs and their duration kept them fluctuating around their respective unchanged lines.
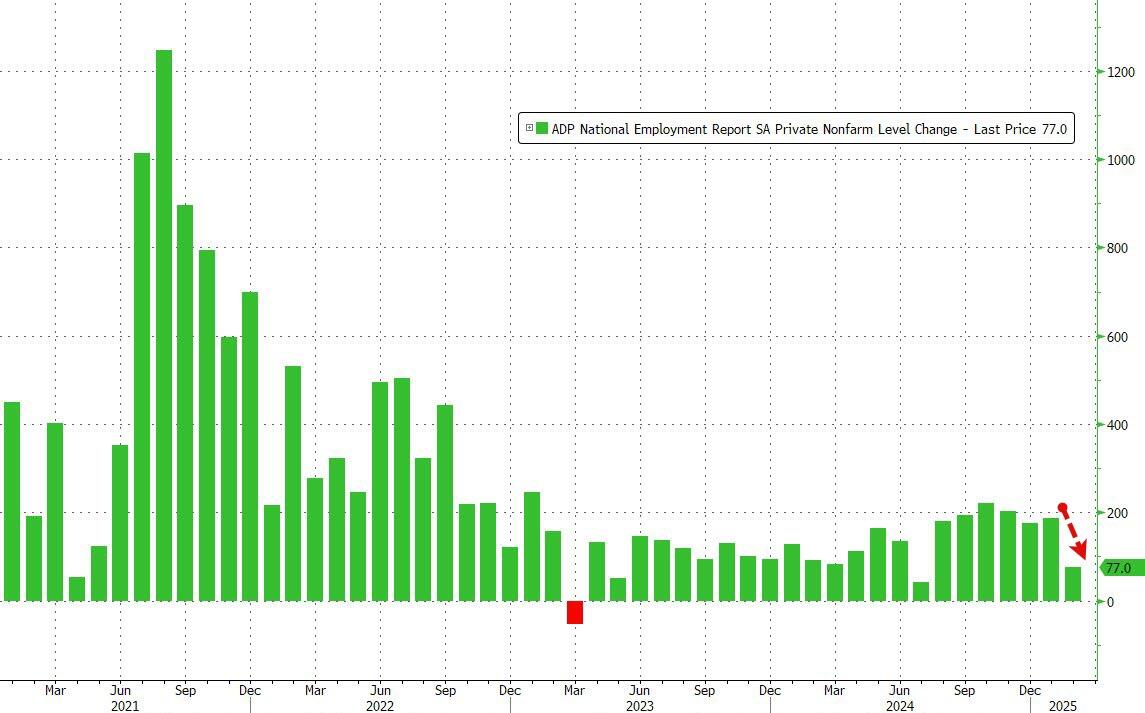
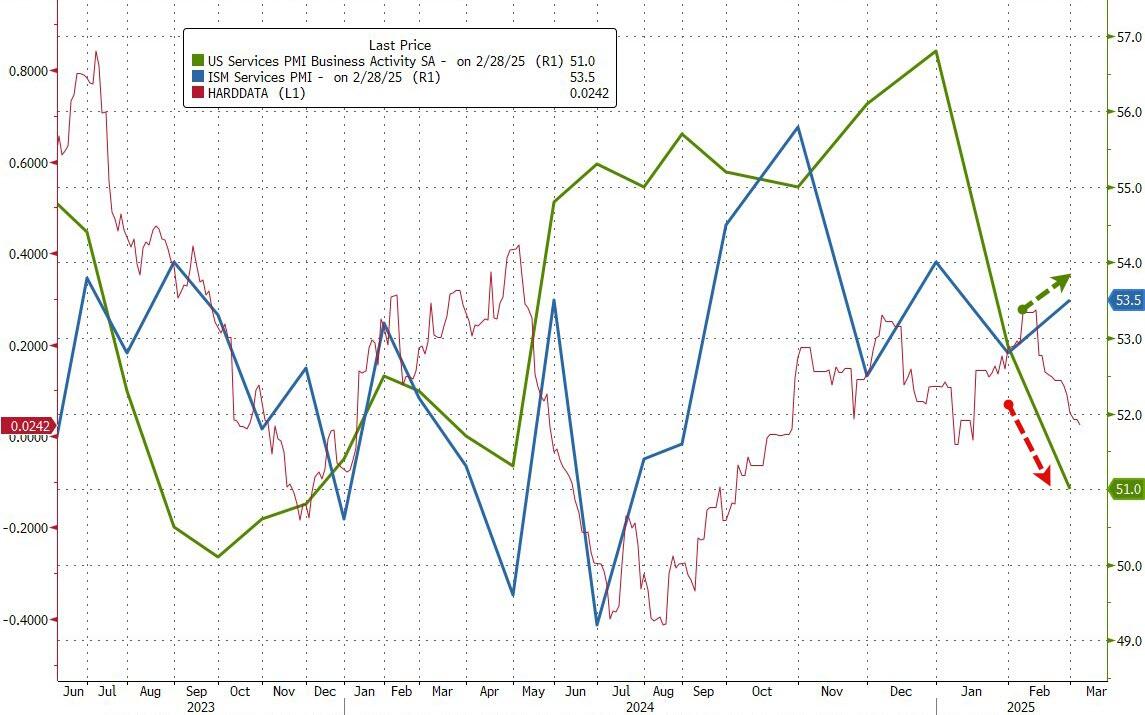
ADV’s private payroll report showed less job growth than anticipated, while service sector data slightly exceeded expectations. This reinforced the view that the economy is cooling.
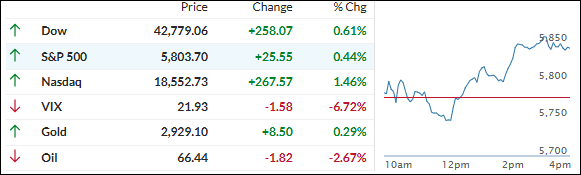
After a lackluster opening, the markets received a boost from a midday announcement by the Trump team, granting a one-month tariff exemption to automakers in Canada and Mexico. This reignited bullish sentiment, pushing the indexes to a solidly green close.
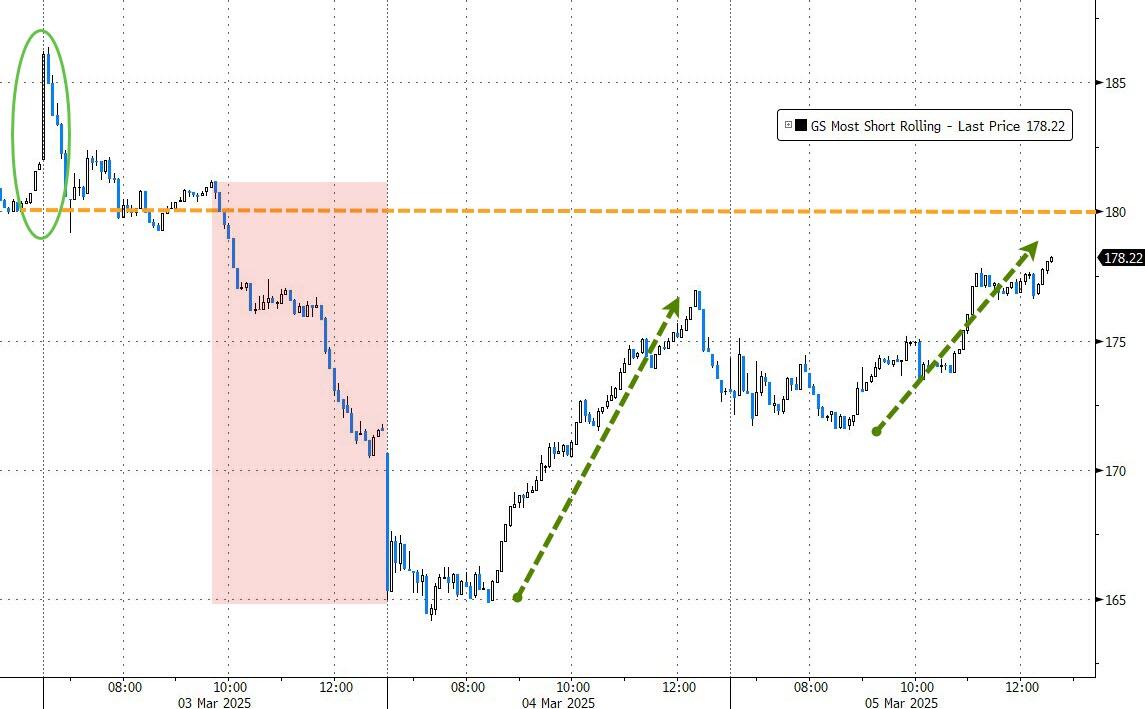
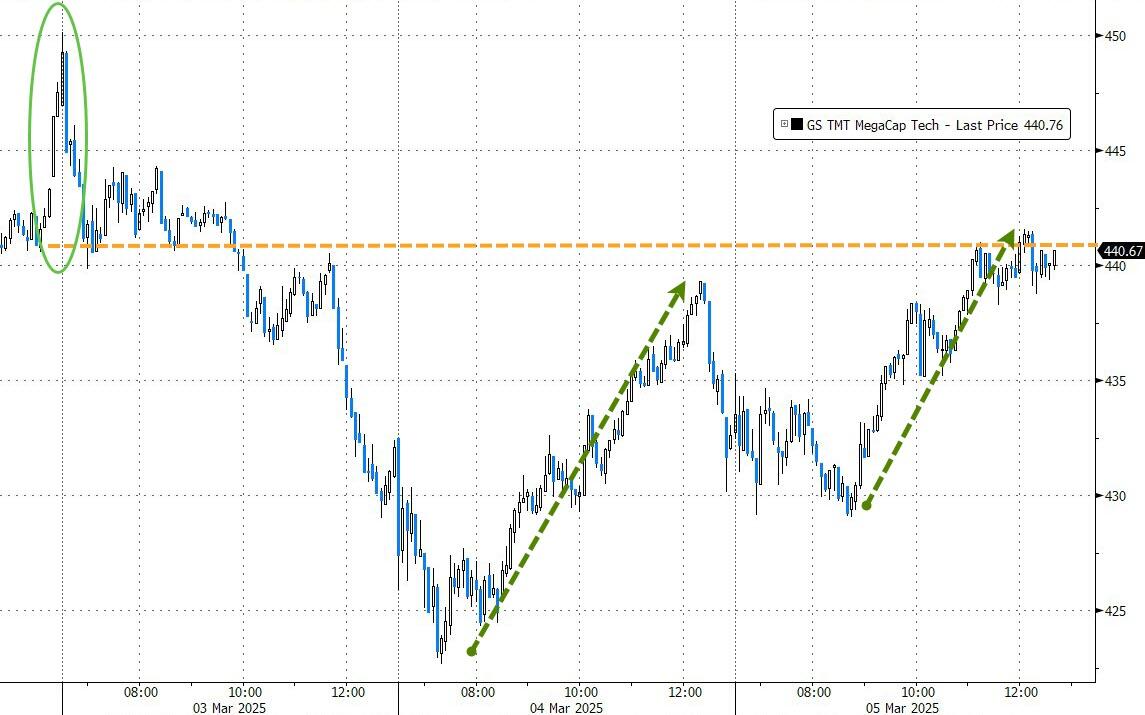
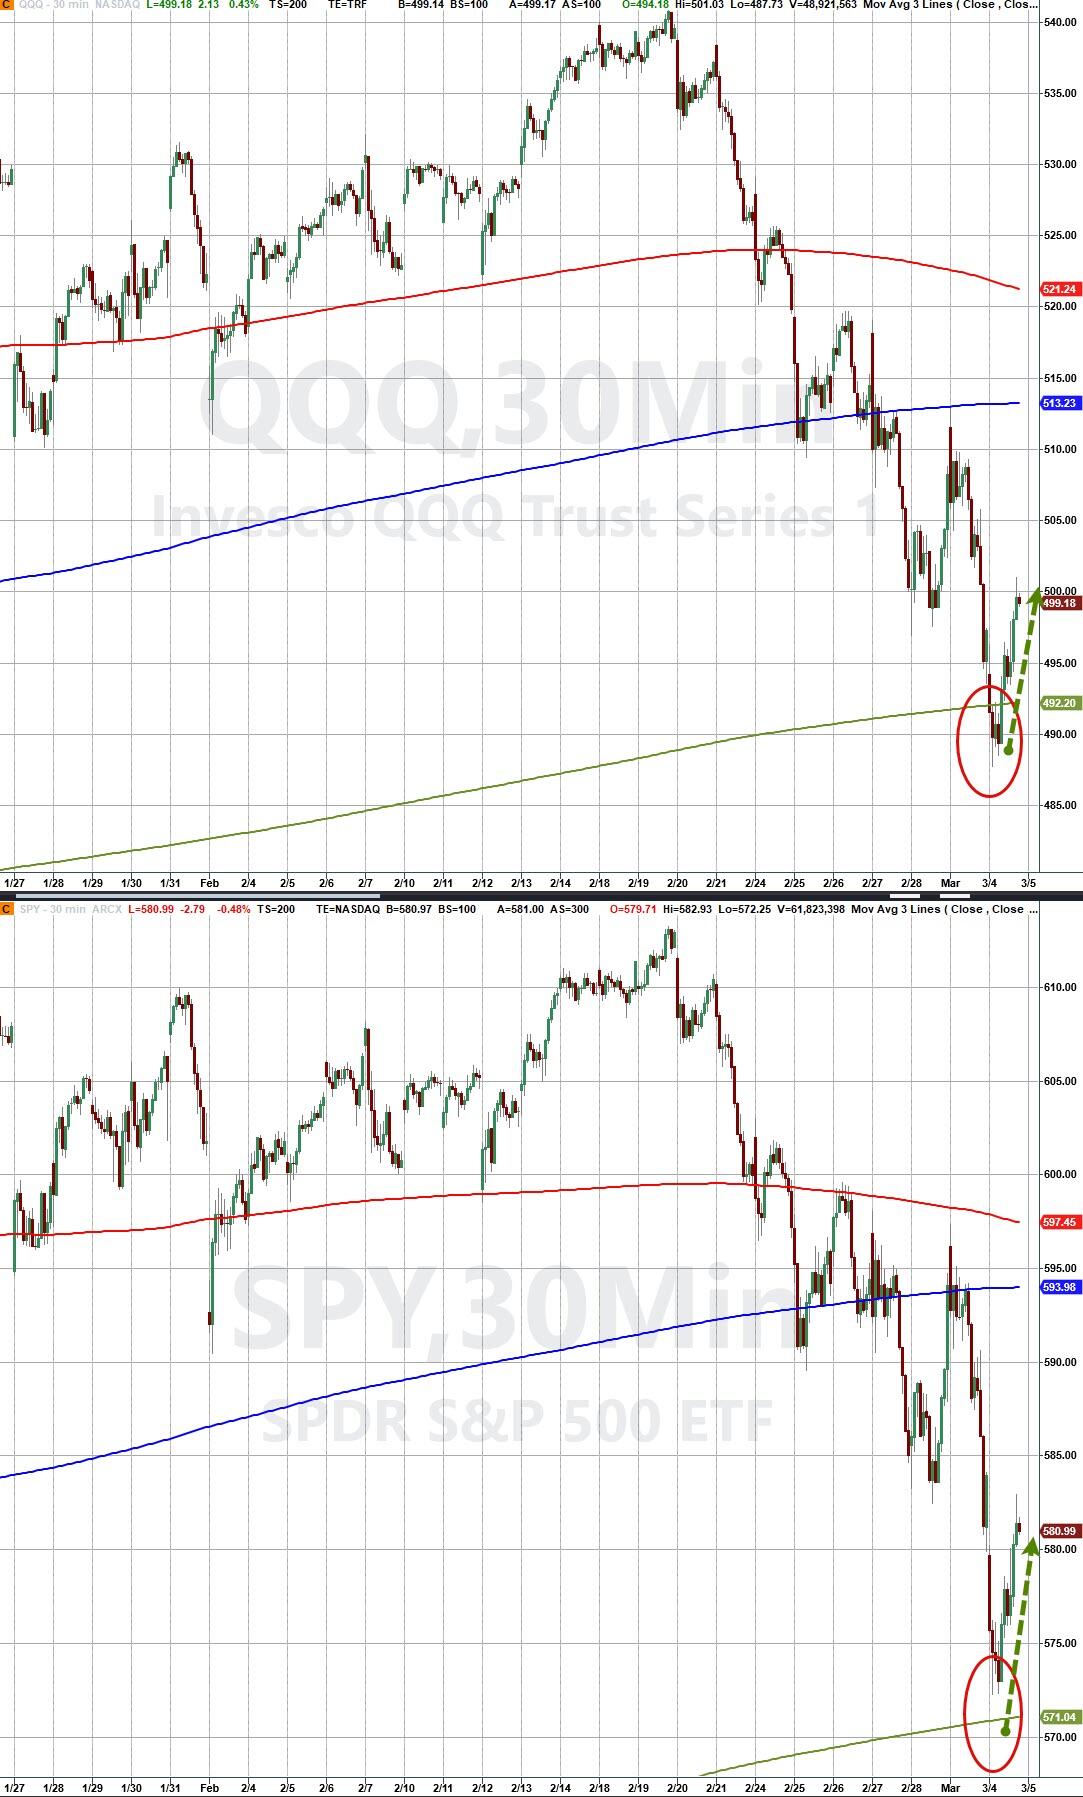
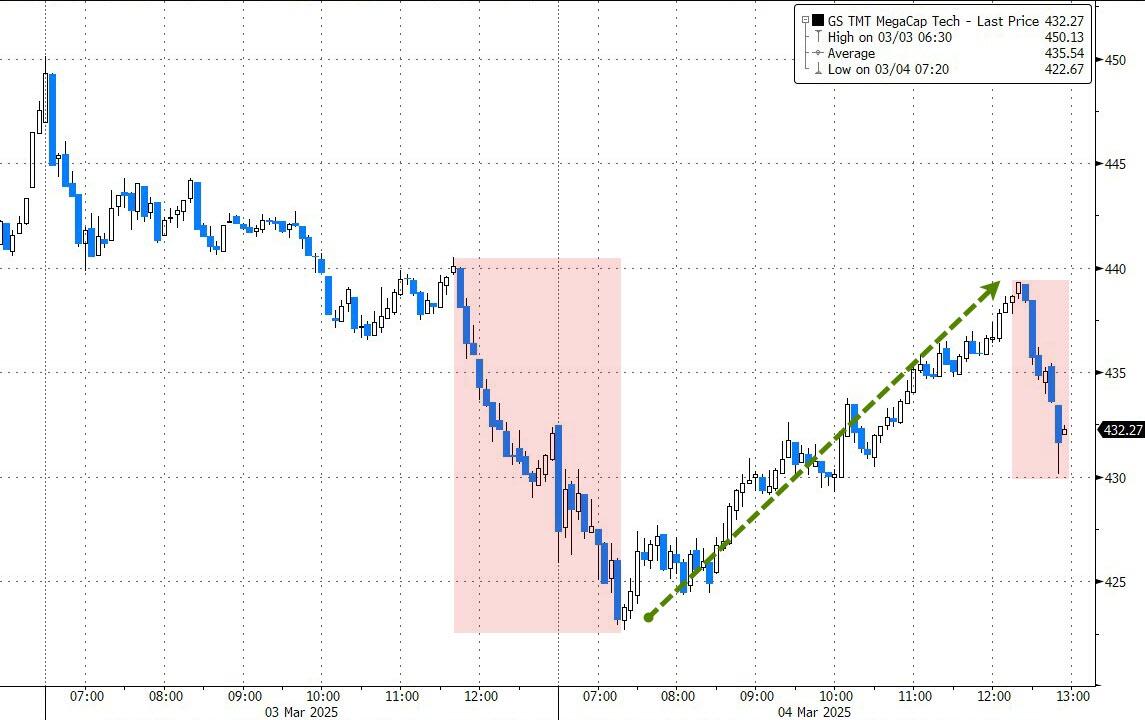
The most shorted stocks were squeezed for the second consecutive day, with mega-cap tech continuing yesterday’s uptrend despite a few dips. The S&P 500 and Nasdaq firmly bounced off their respective 200-day moving averages.
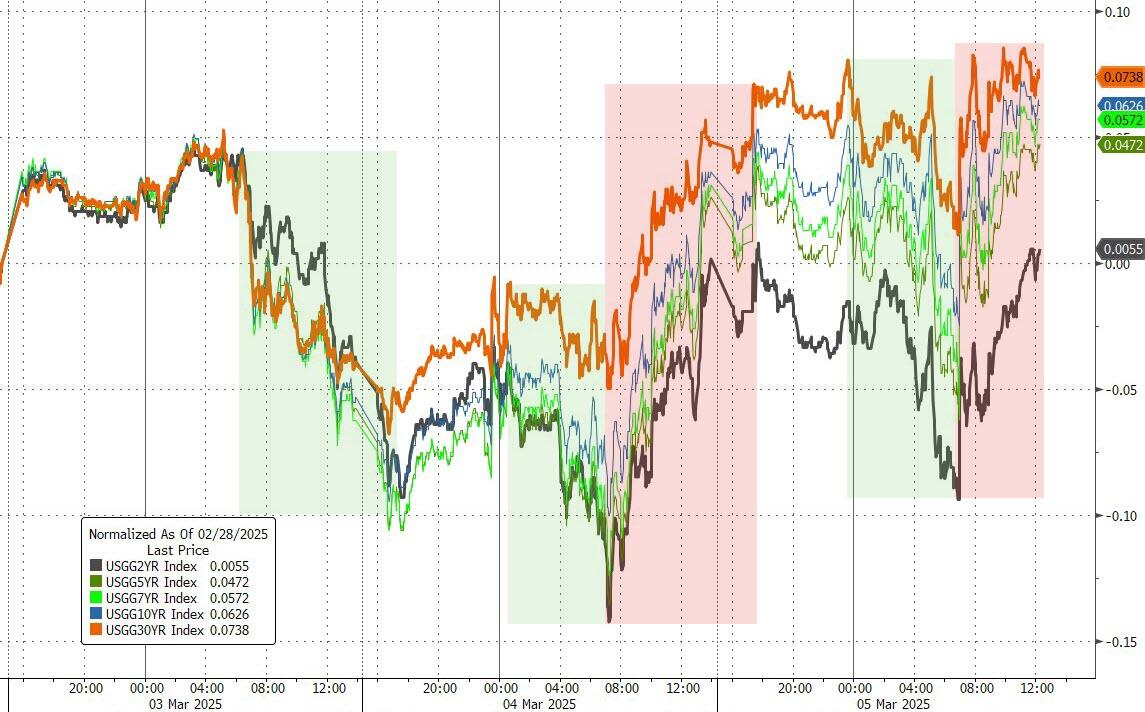
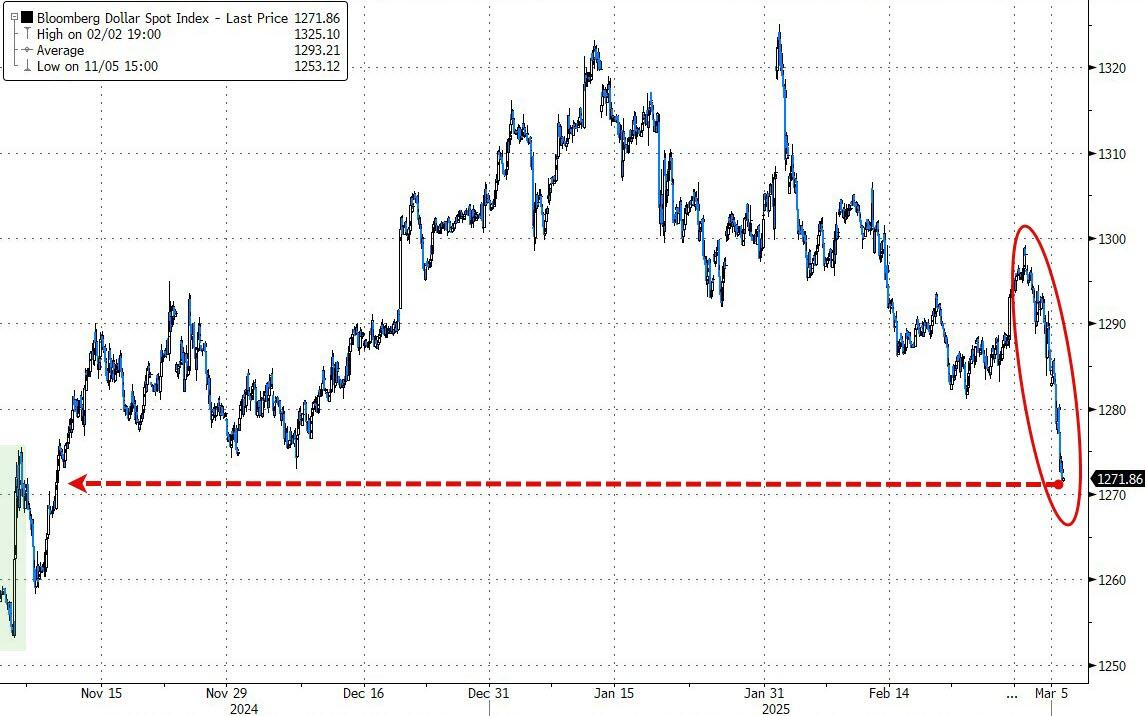
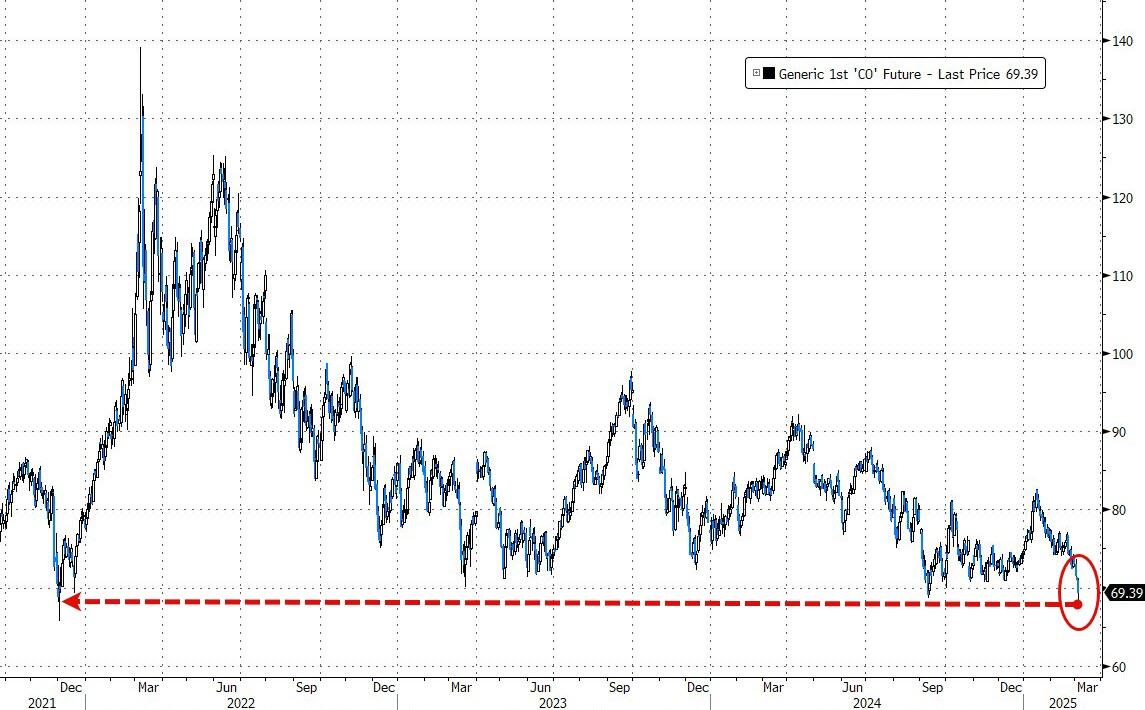
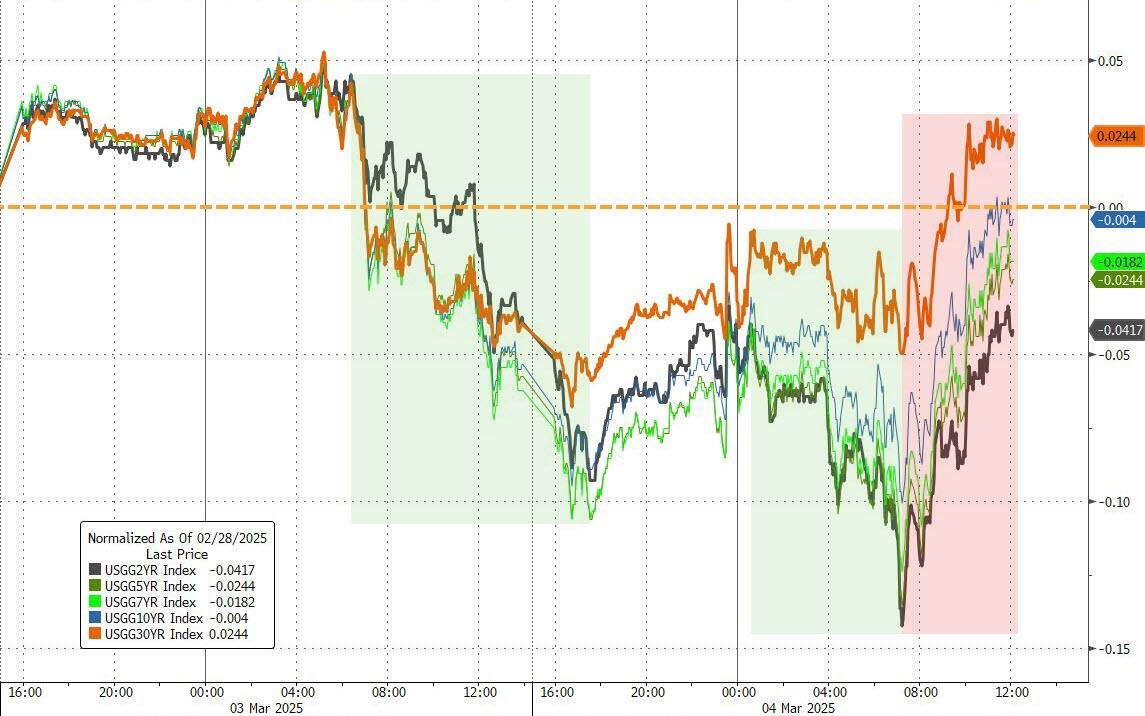
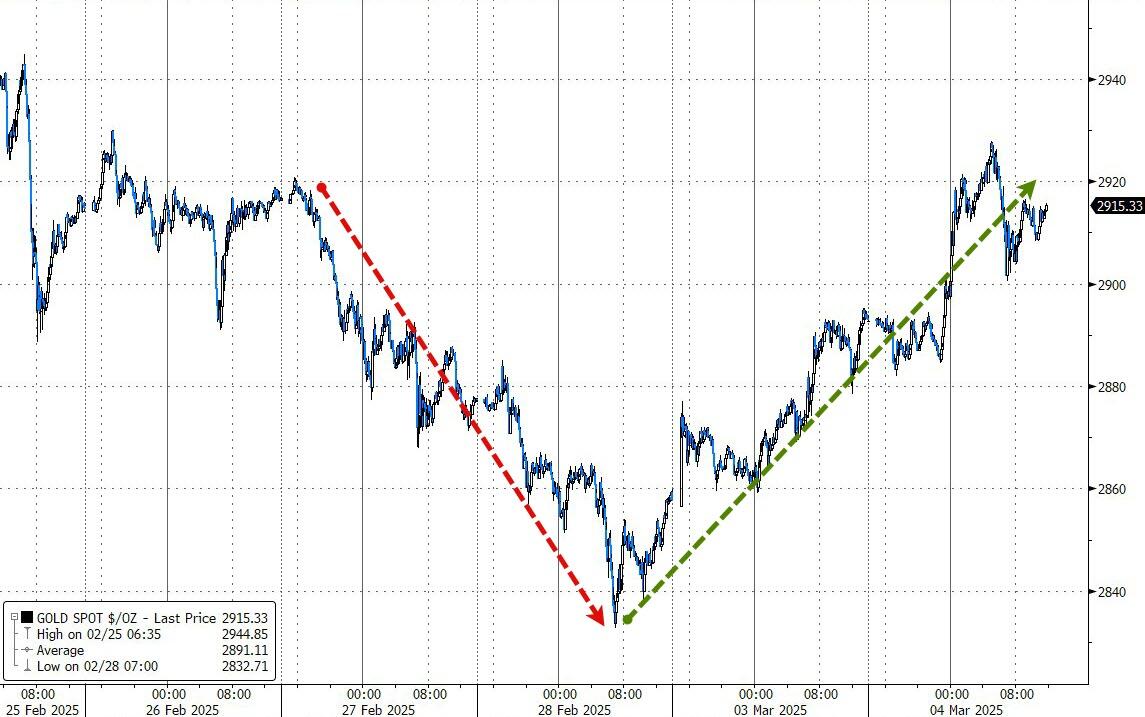
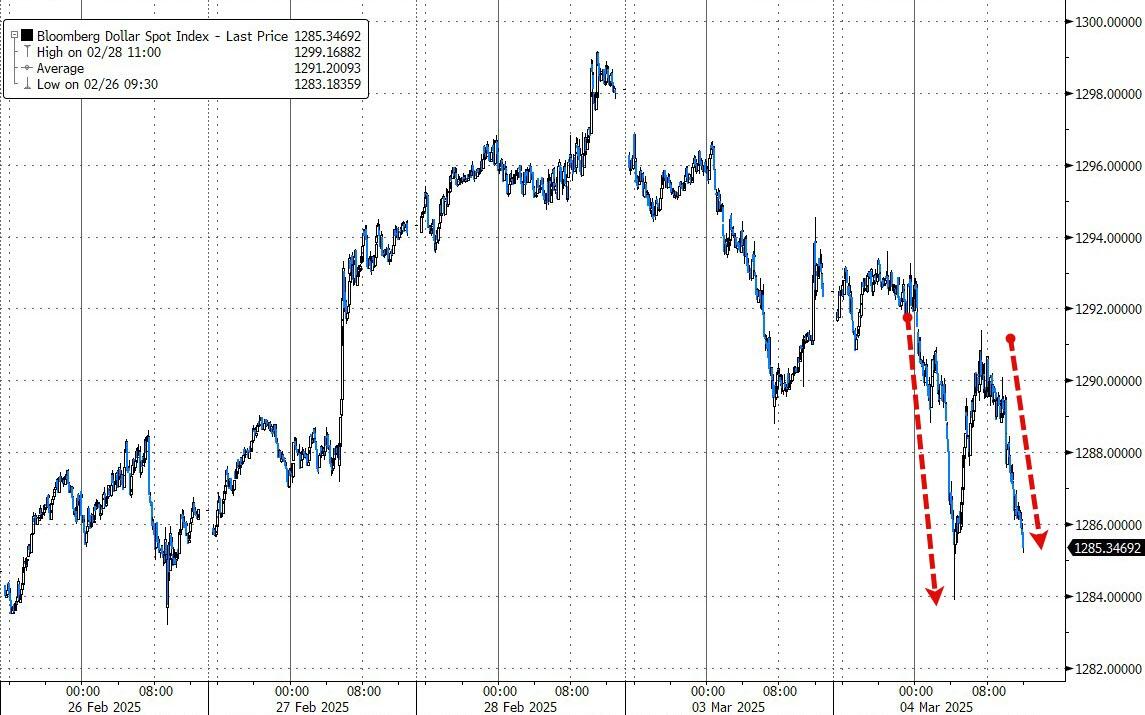
Bond yields faced volatility, with the 10-year yield slightly rising. The dollar and crude oil both declined, while gold surged to close above $2,920.
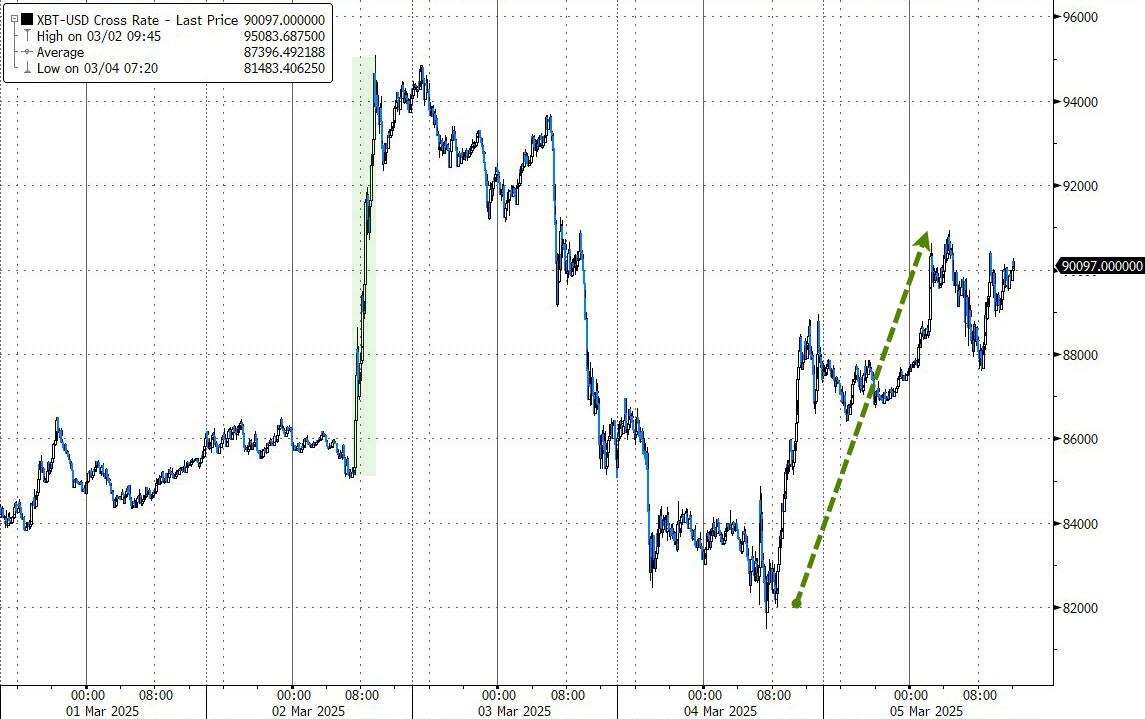
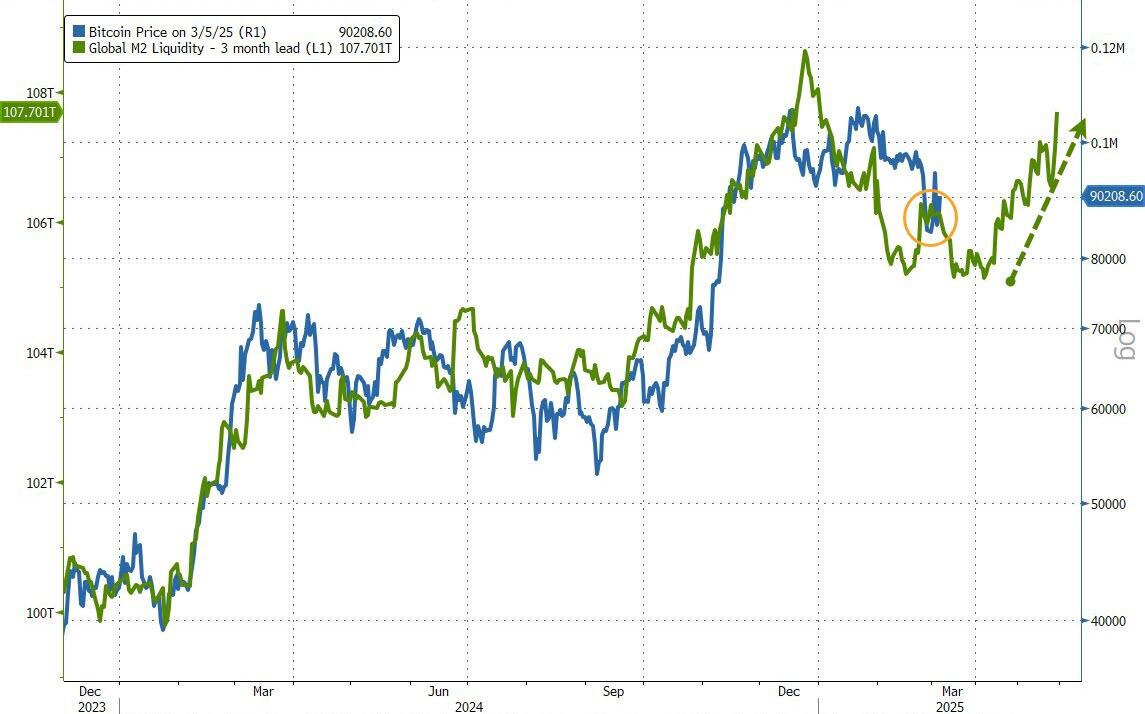
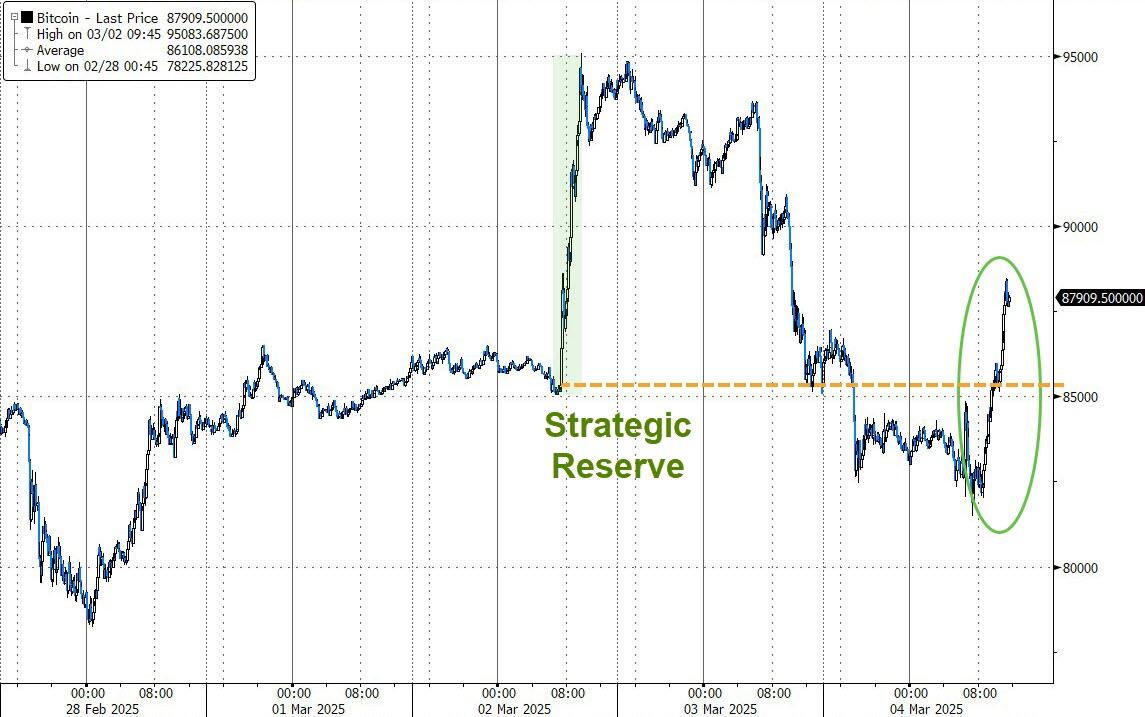
Bitcoin built on yesterday’s rebound to reach the $90k level again. According to ZH, if the trend of global liquidity holds true, Bitcoin may have one more dip to the $80k area before recovering and charging into record territory.
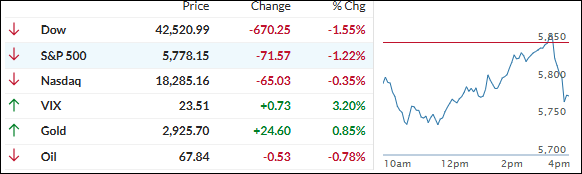
Equities continued their downward slide today as Trump’s tariffs on China, Mexico, and Canada went into effect. The affected countries announced retaliatory measures, sparking fears among traders of an all-out trade war and its potential negative economic impacts.
Monday’s market drop pushed the widely followed S&P 500 into the red for the year, with losses deepening today as hopes for a last-minute deal to avoid these confrontations faded.
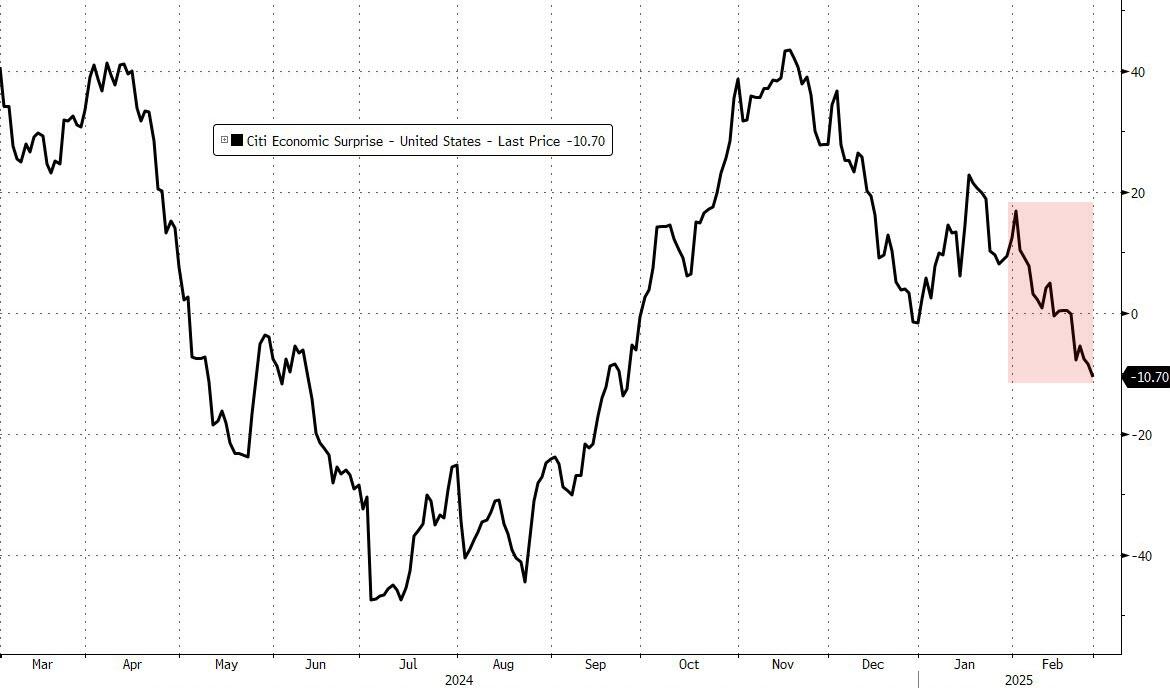
Given the current economic conditions, as indicated by the deteriorating macro index, equities are likely to face a rough ride unless the tariff situation proves to be more of a negotiation tactic than an enduring trade war.
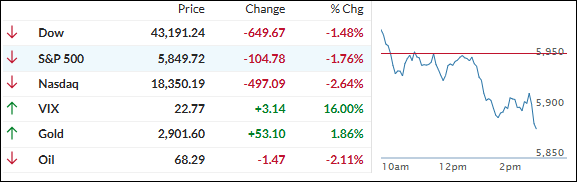
A mid-day rebound saw the S&P 500 and Nasdaq bounce off their respective 200-day moving averages and into positive territory. However, this attempt failed, and the major indexes reversed course, closing in the red but off their morning lows, with the Dow leading the decline.
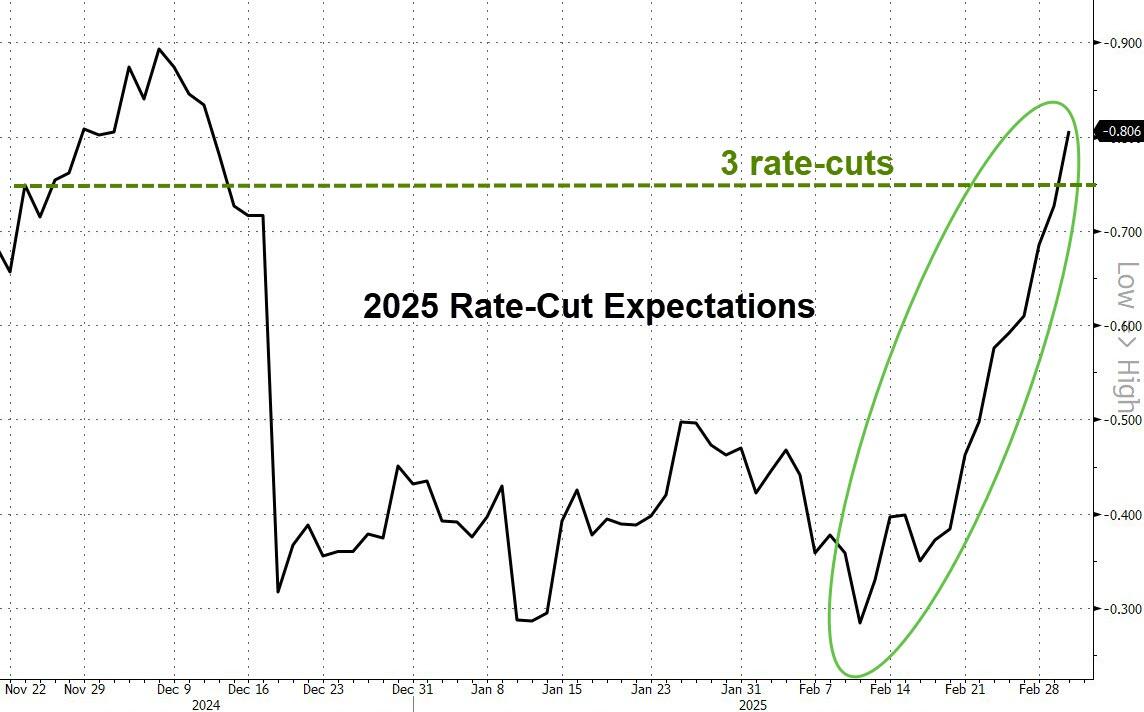
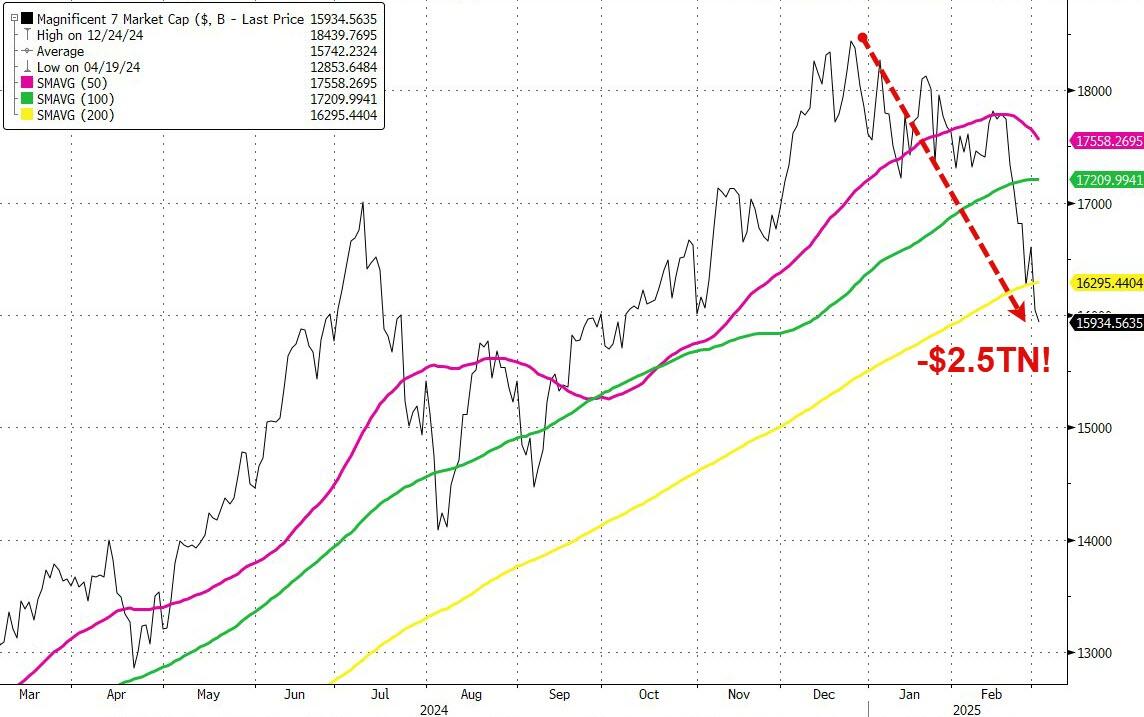
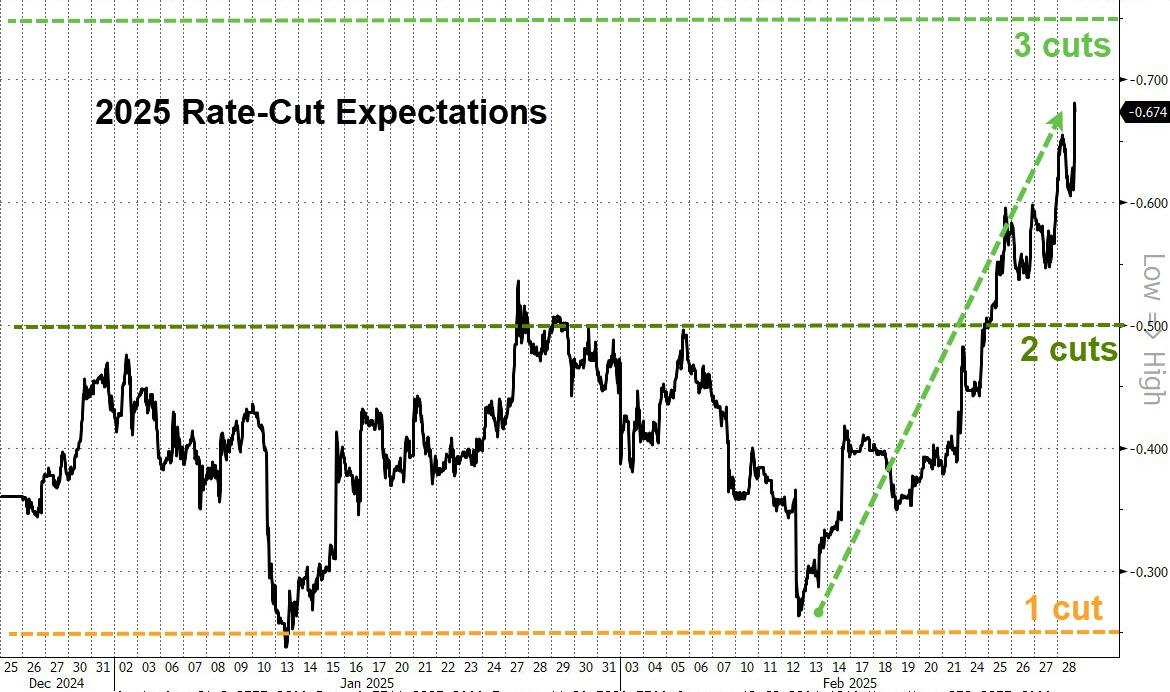
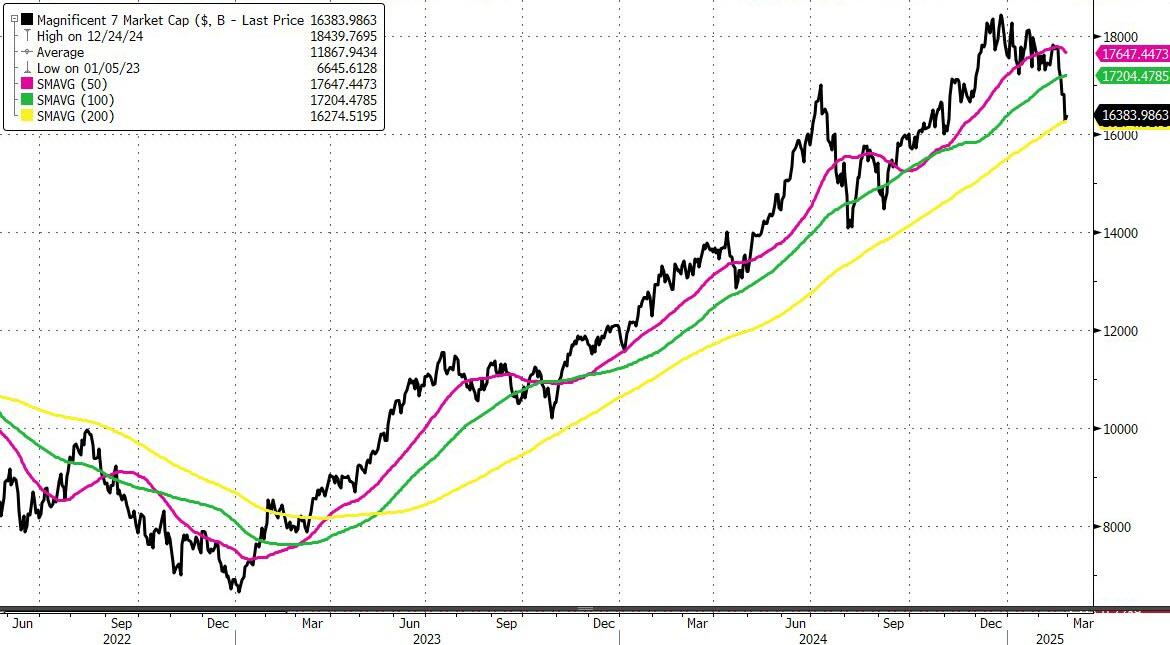
Bond yields were mixed, but expectations for rate cuts in 2025 soared to three. Big Tech experienced its own rollercoaster ride, with significant fluctuations throughout the day. The Mag7 basket saw a $2.5 trillion swing in market cap from highs to lows.
Bitcoin and gold provided some relief, with Bitcoin bouncing back strongly and gold trending higher with only minor dips.
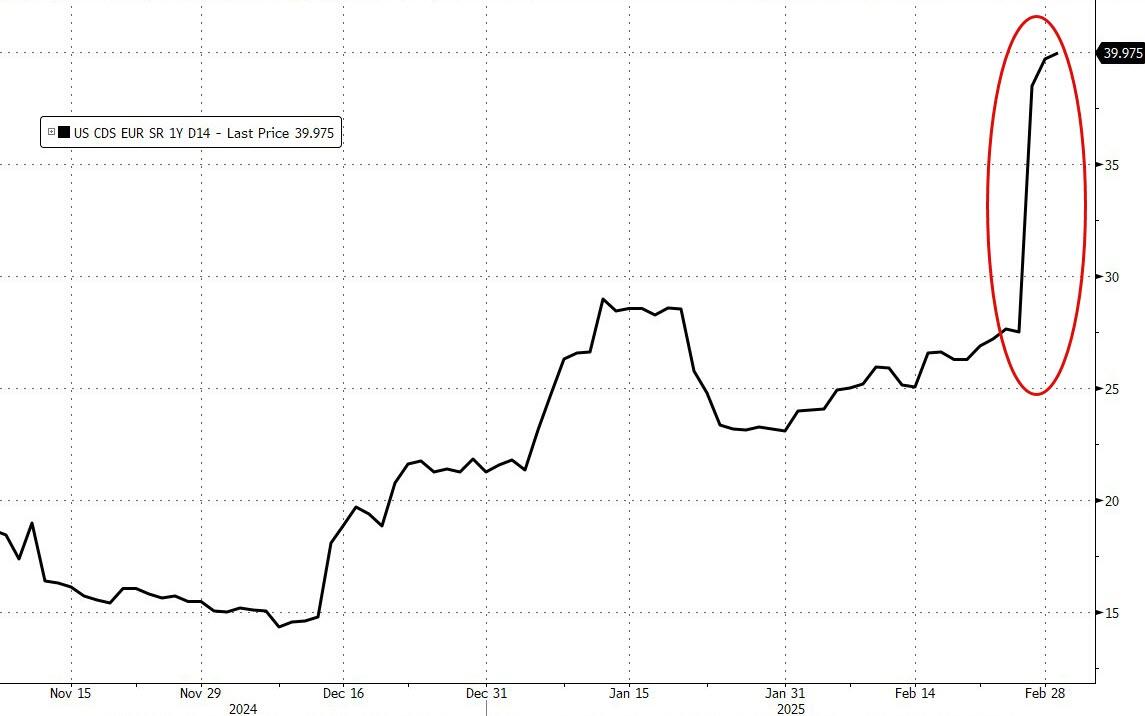
The dollar ended lower, and with a potential government shutdown looming, the risk of a U.S. sovereign default is once again rising, as highlighted by ZH.
To say we are living in interesting times seems to be an understatement.
Equities started the first trading day of March with aimless meandering, leading to a rocky start.
Soft economic data from the construction and manufacturing sectors released today raised concerns about the state of the economy, causing major indexes to head sharply south and nearly wipe out Friday’s gains.
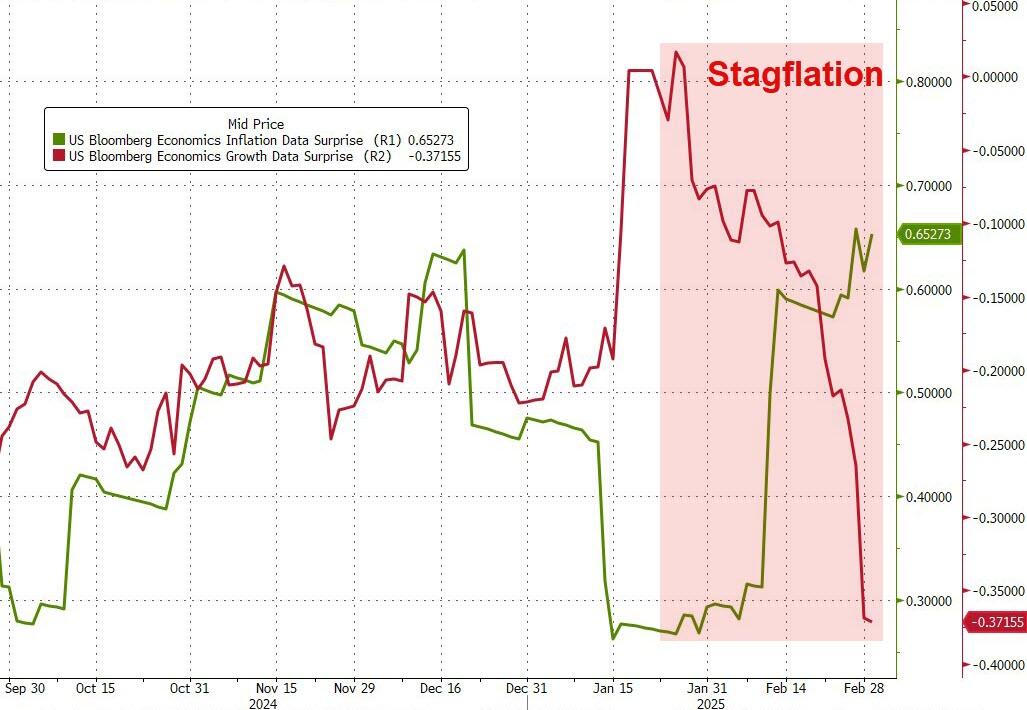
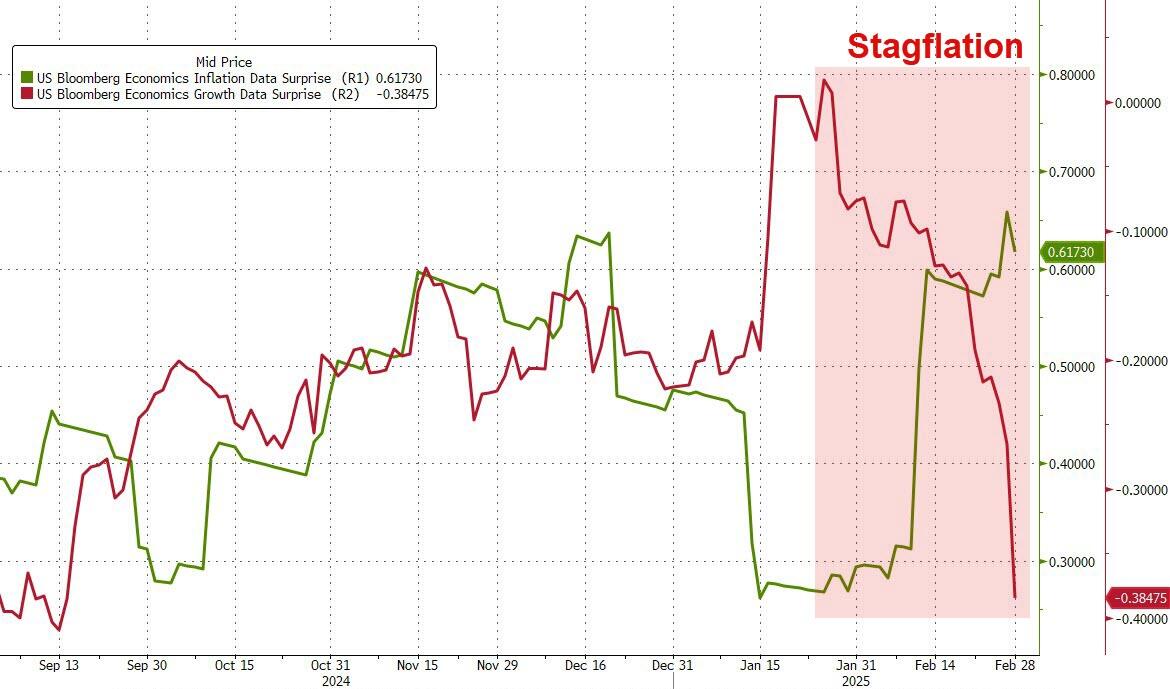
This reinforces the point that we have reached a stagflation scenario—low or no growth with rising inflation.
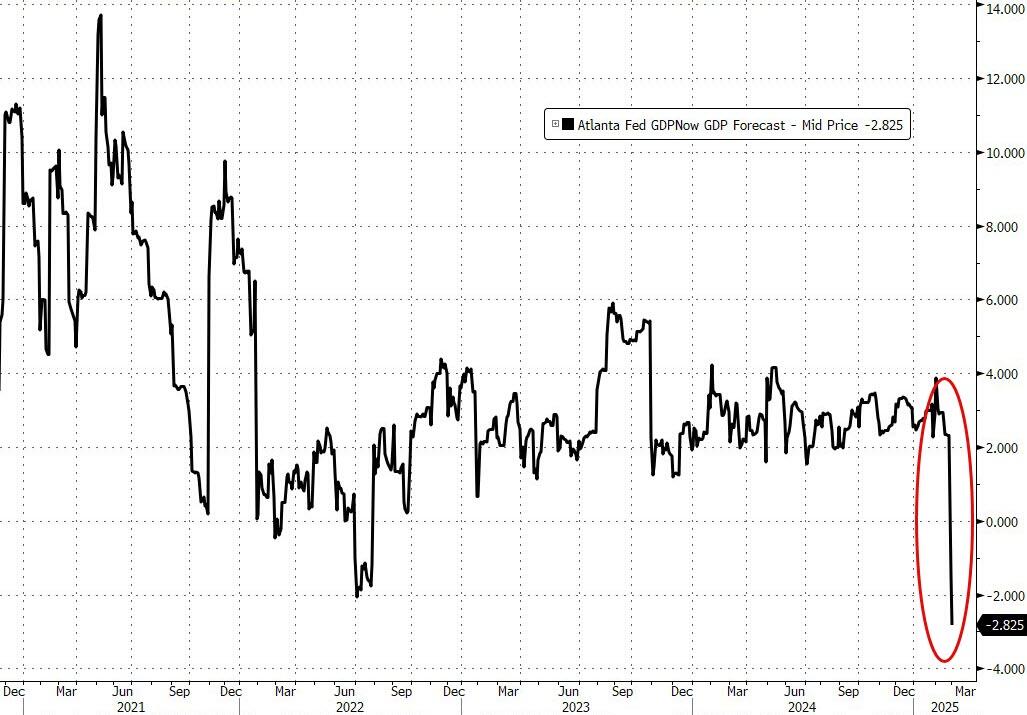
This week is crucial, with various data releases culminating in the February jobs report on Friday. Today, the Atlanta Fed slashed its GDPNOW forecast for Q1 to the worst level since the COVID lockdowns, confirming the current economic weakness.
Trump’s plans to impose import duties on Canada and Mexico are looming large this week, rattling traders and creating market volatility, as worries about more inflation remain in the foreground.
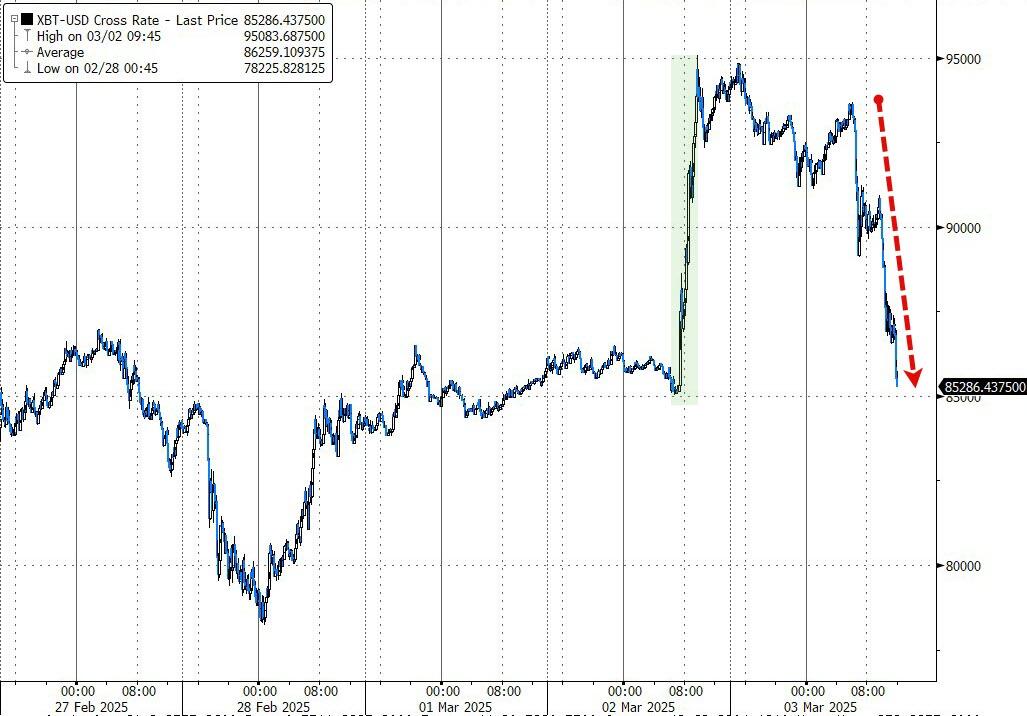
Over the weekend, Trump’s announcement of a strategic crypto reserve for the U.S., which will include a variety of coins, helped cryptocurrencies. Bitcoin jumped 10% to nearly $95k after dropping below $80k last Friday. However, today’s pullback towards the $85k area negated much of the positive effect.
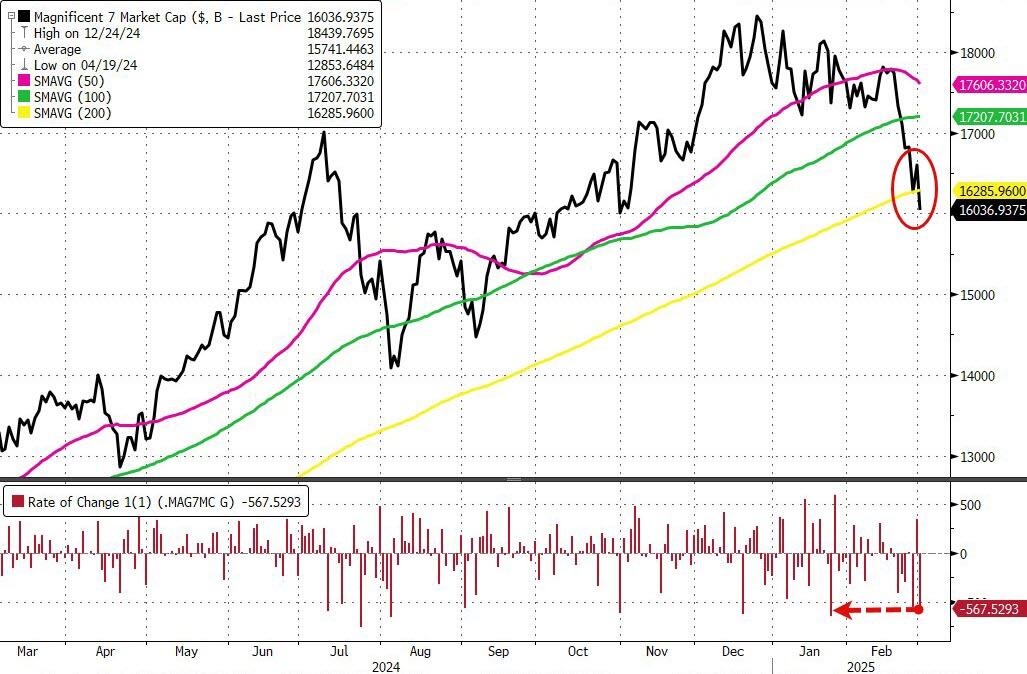
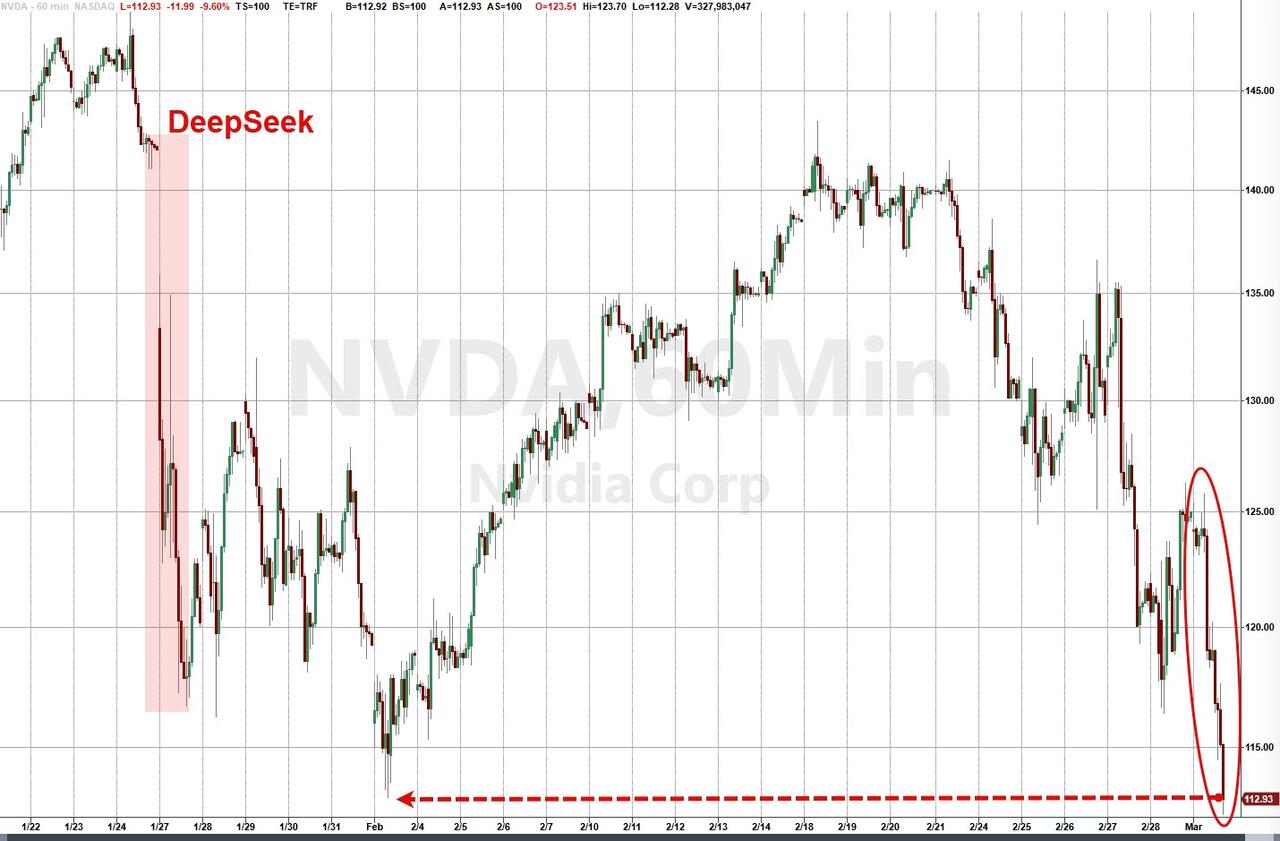
With the Nasdaq leading today’s decline, it’s no surprise that the Mag7 basket took a hit, losing a stunning $570 billion and breaking below its 200 DMA, which could invite more selling. Nvidia tanked, reaching its February lows, with all AI stocks now in the red year-to-date.
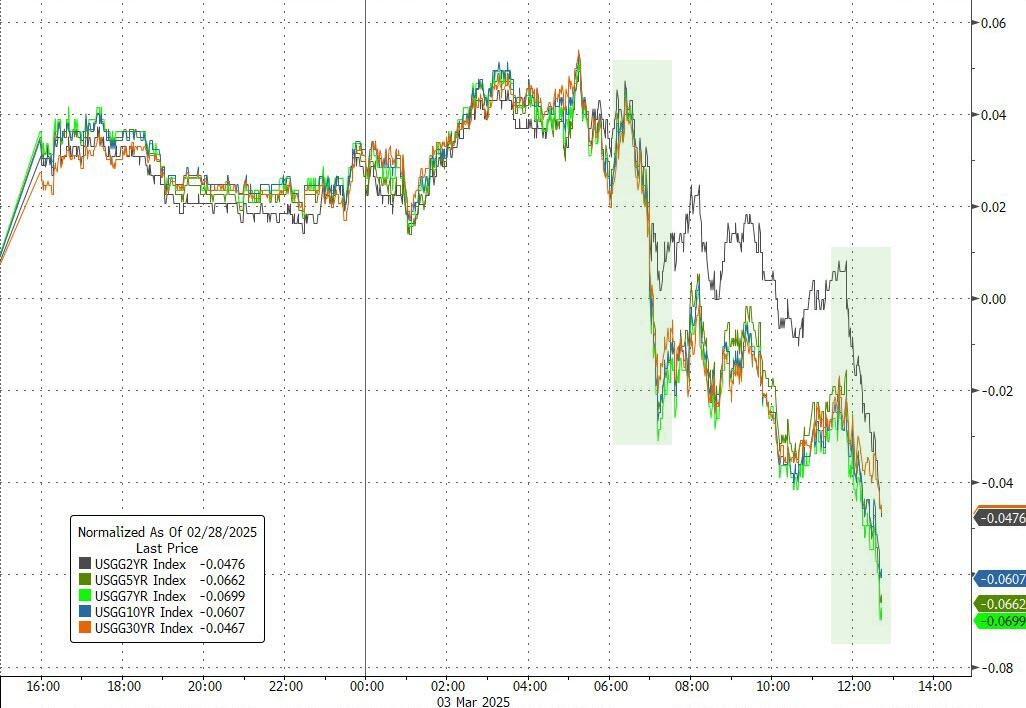
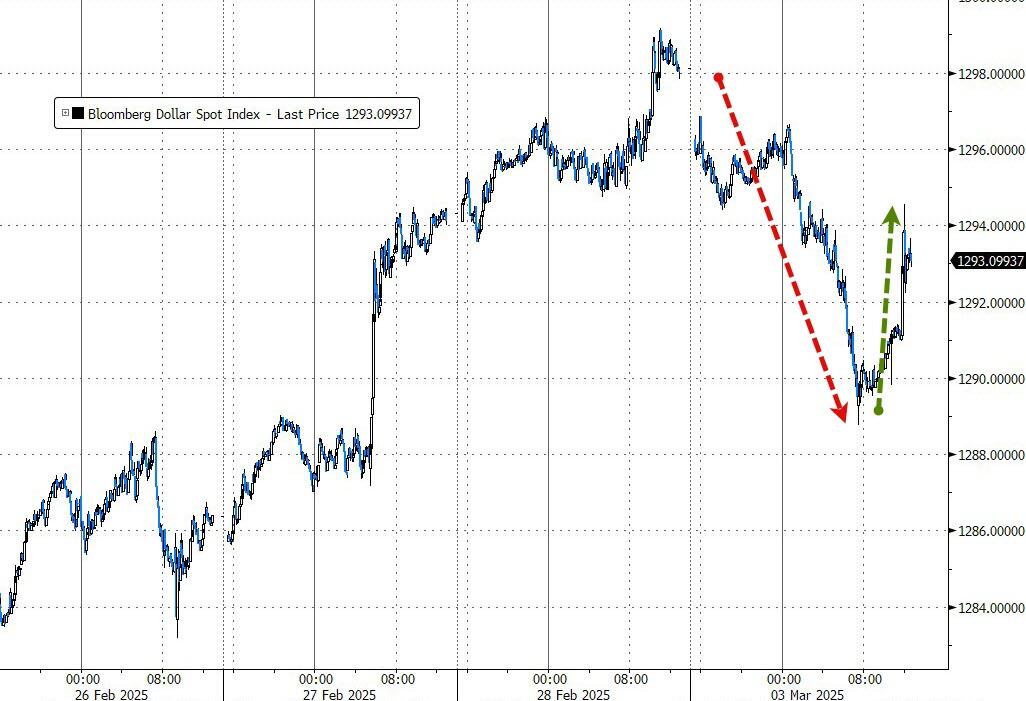
Even plunging bond yields couldn’t stem the downward tide, as the dollar ended lower despite a late session rebound, leaving gold as the only winner for the day, with the precious metal back over the $2,900 level.
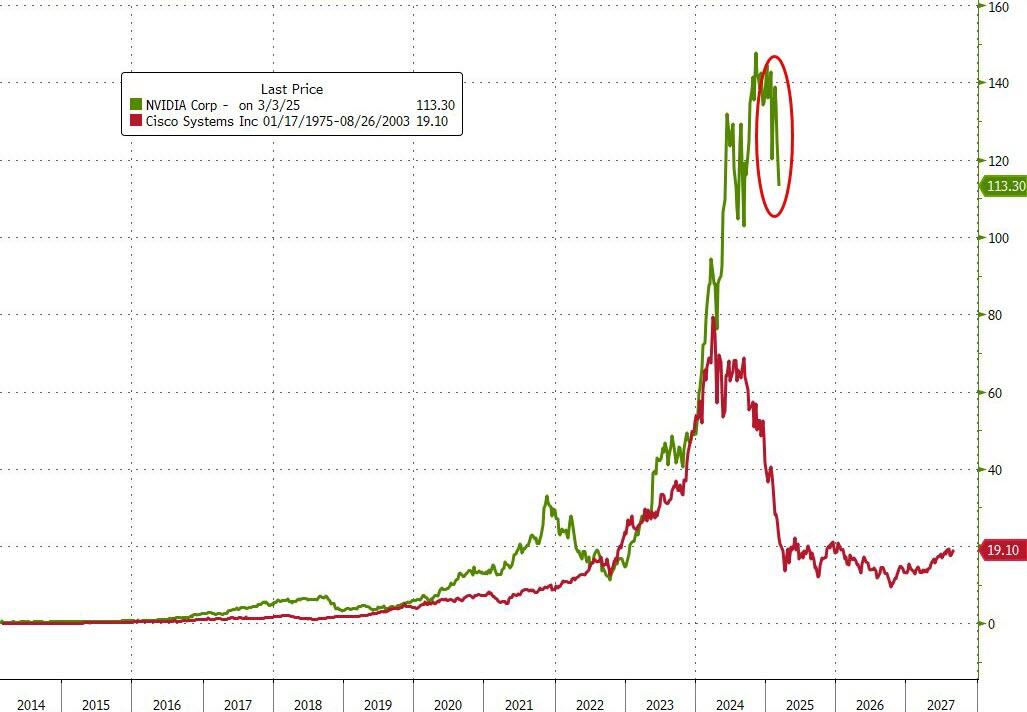
With Nvidia appearing to be in retreat mode, this old analog, thanks to ZH, was updated, bringing back the question: Can history repeat itself?
Do you want to know which ETFs are hot and which ones are not? Then you need my High-Volume ETF Cutline report. It tells you how close or far each of the 311 ETFs I follow is from its long-term trend line (39-week SMA). These are the ETFs that trade more than $5 million a day, so they are not some obscure funds that nobody cares about.
The report is split into two parts: The winners that are above their trend line (%M/A), and the losers that are below it. The yellow line is the line of shame that separates them. You can see how many ETFs are in each group and how they have changed since the last report (201 vs. 215 current).
VOLATILE FEBRUARY ENDS WITH EQUITIES RECOVERING STRONGLY
[Chart courtesy of MarketWatch.com]
Moving the market
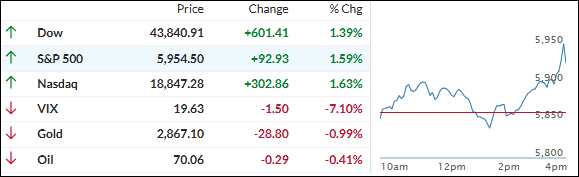
The major indexes advanced this morning as the much-anticipated PCE index, the Fed’s preferred inflation gauge, met expectations.
The data showed that inflation eased slightly in January, increasing by 0.3% for the month and 2.5% on an annual basis. The core PCE, which excludes food and energy prices, also rose by 0.3% for the month and 2.6% annually.
While this may keep the Fed in pause mode for now, inflation will need to soften considerably, or employment data will have to weaken before the Fed considers cutting rates again.
February, historically the weakest and most volatile period for stocks, has lived up to its reputation this year. Greater clarity on tariffs, inflation, and consumer health may help the markets recover.
Mid-session, the major indexes took a sharp dive into the red following news of a “testy” exchange between Trump and Zelensky during their meeting in Washington. However, traders were relieved as equities quickly recovered and closed solidly in the green, marking the end of a tumultuous February.
For the month, the Economic Surprise index declined, with most data points disappointing. The stagflation scenario—no growth and rising inflation—remains a concern.
Despite rising rate-cut expectations, the major indexes fell in February, led by Small Caps, with the S&P 500 losing 1.4% but barely remaining in the green year-to-date.
The Mag7 basket saw a dramatic $2.2 trillion drop in market cap from December highs, marking its second-largest monthly decline ever, as noted by ZH.
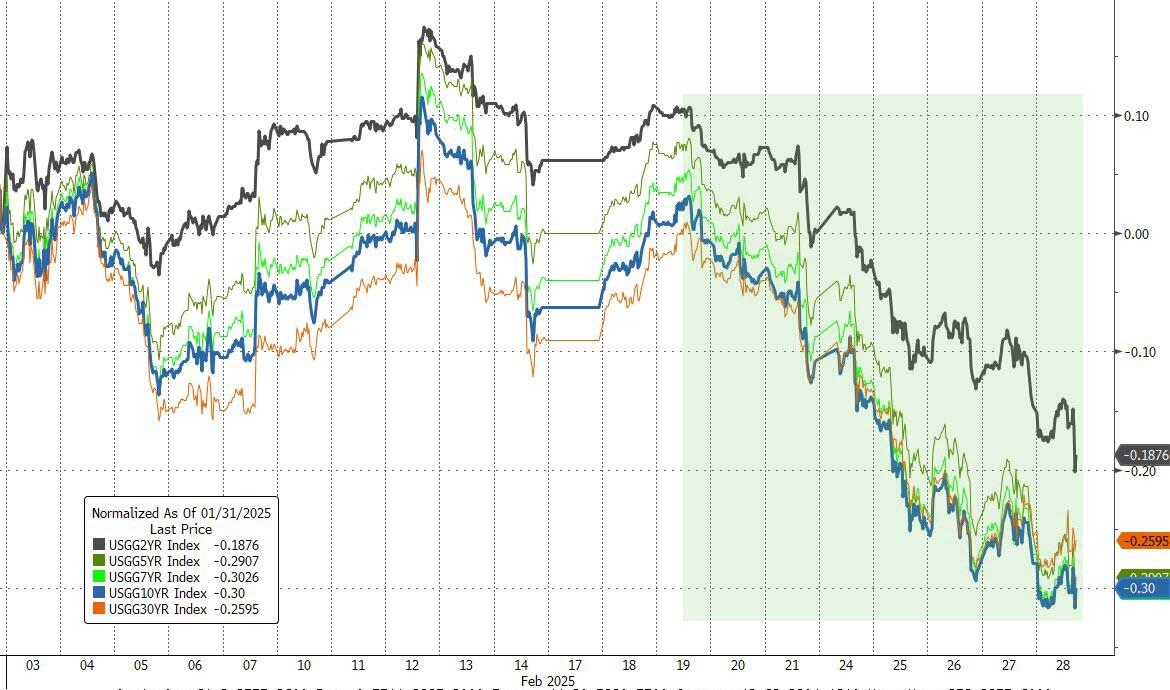
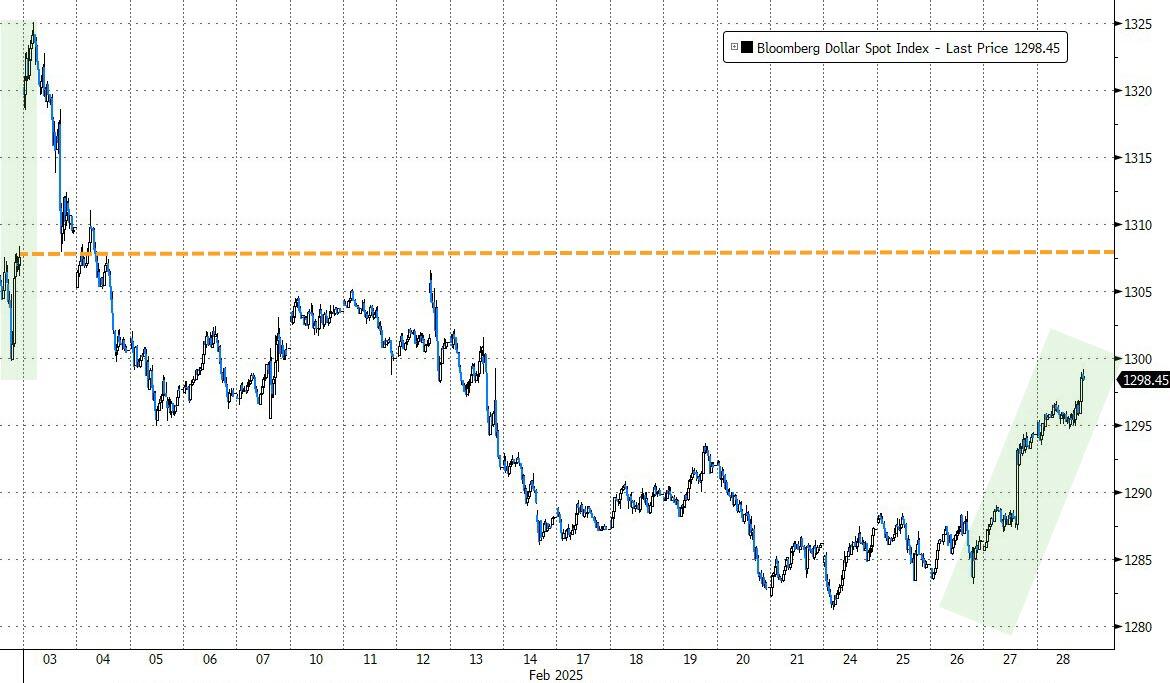
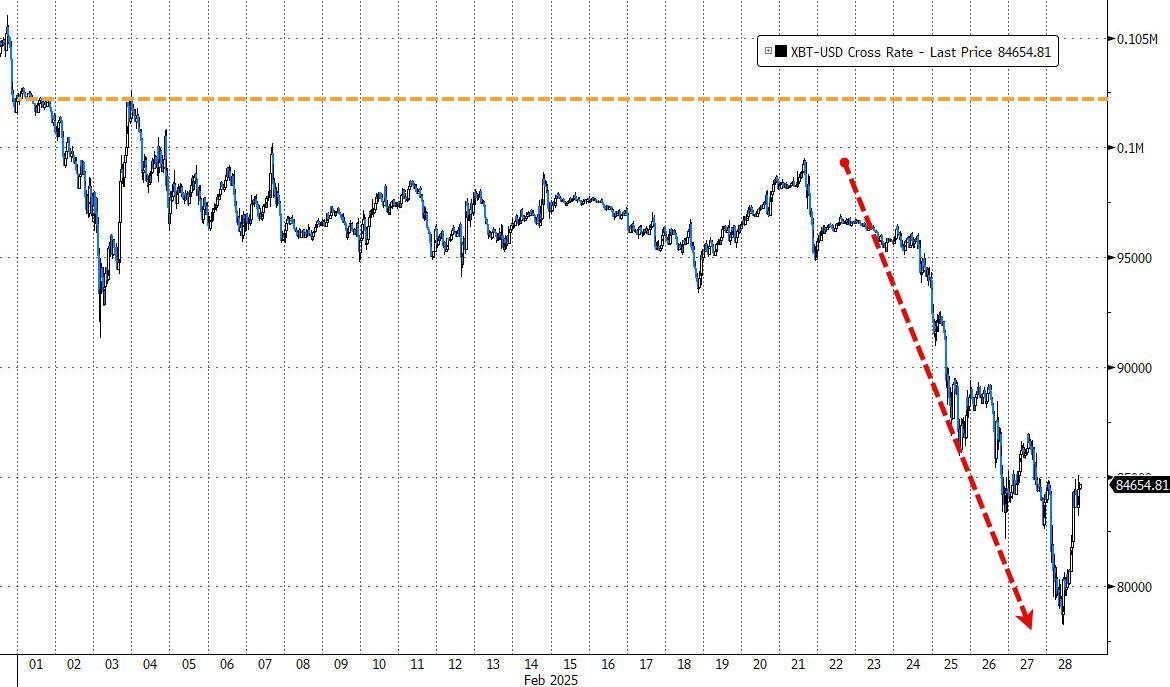
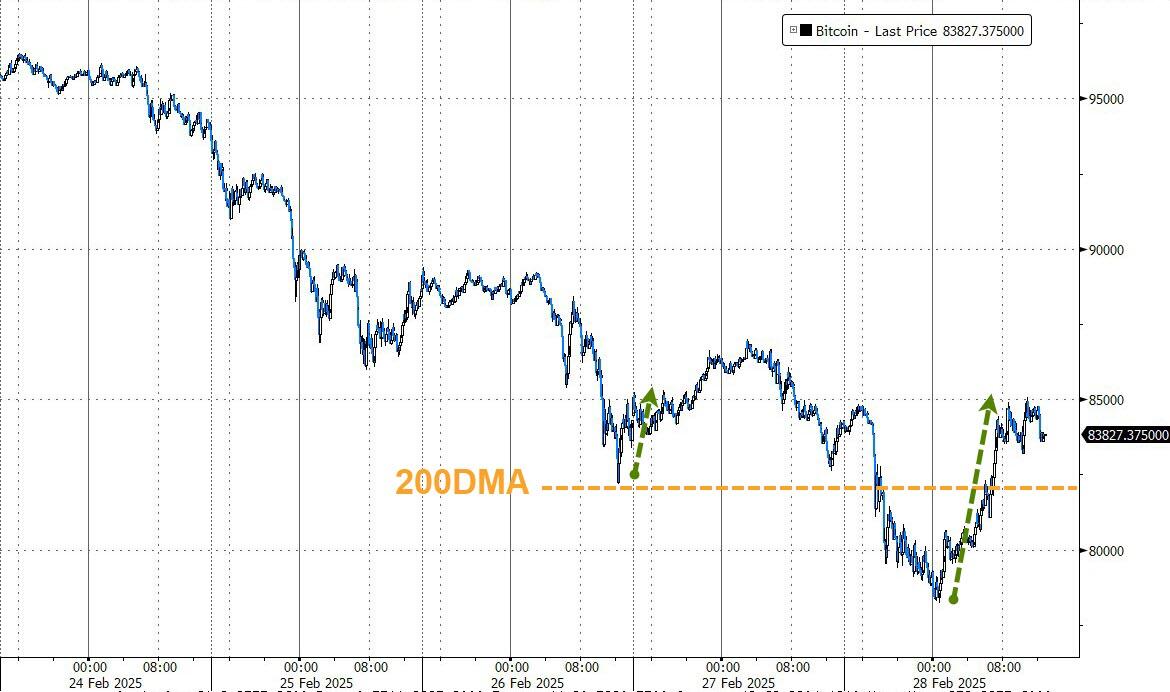
Bond yields, which rose in the first half of the month, reversed, and collapsed in the latter half. The dollar closed lower after an early spike, and Bitcoin’s downturn accelerated with increased ETF outflows, though it bounced strongly off its 200-day moving average today.
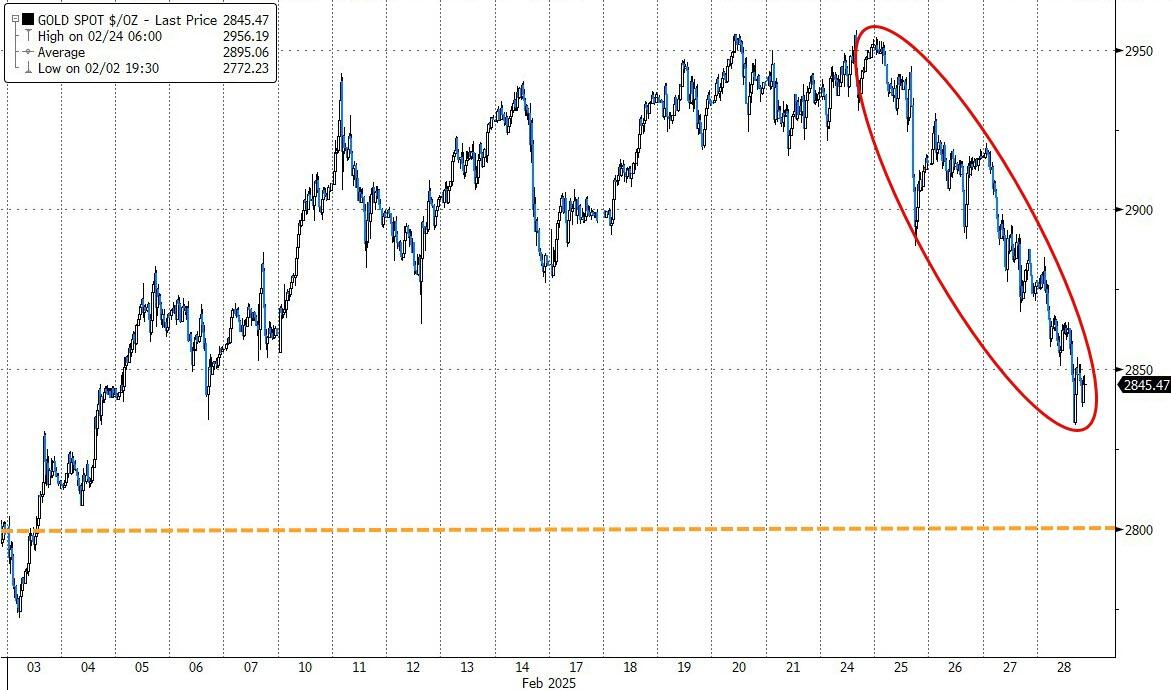
Gold emerged as the winner, maintaining gains despite selling pressure in the last week.
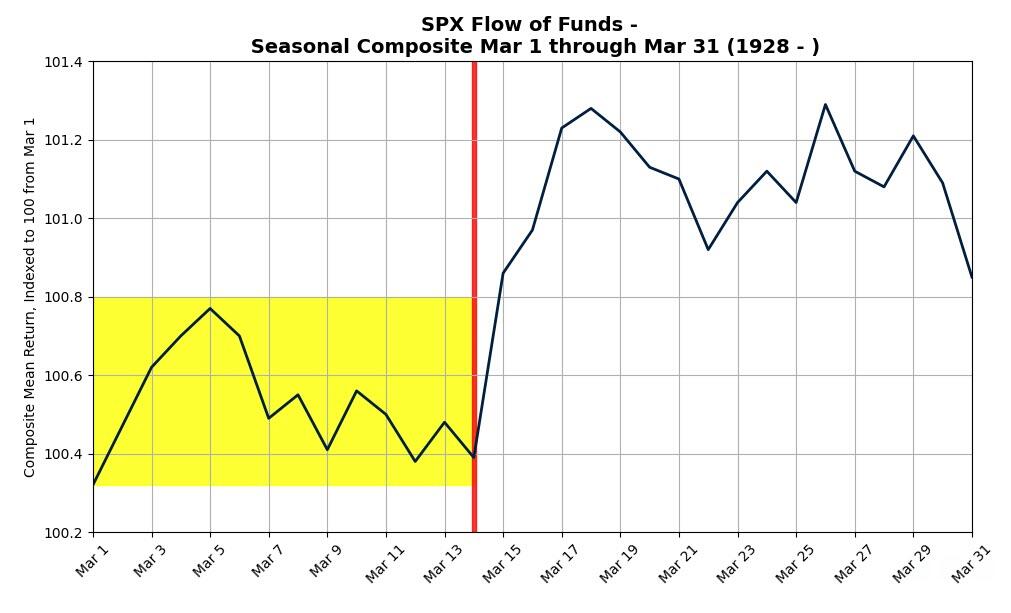
The seasonal composite indicates we are in a period of uncertainty, with trend direction potentially changing after March 13—if historical patterns hold true.
ETF Data updated through Thursday, February 27, 2025
How to use this StatSheet:
Out of the 1,800+ ETFs out there, I only pick the ones that trade over $5 million per day (HV ETFs), so you don’t get stuck with a lemon that nobody wants to buy or sell.
Trend Tracking Indexes (TTIs)
These are the main indicators that tell you when to buy or sell Domestic and International ETFs (section 1 and 2). They do that by comparing their position to their long-term M/A (Moving Average). If they cross above, and stay there, it’s a green light to buy. If they fall below, and keep going, it’s a red light to sell. And to make sure you don’t lose your shirt if things go south, I also use a 12% trailing stop loss on all positions in these categories.
All other investment areas don’t have a TTI and should be traded based on the position of each ETF relative to its own trend line (%M/A). That’s why I call them “Selective Buy.” In other words, if an ETF goes above its own trend line, you can buy it. But don’t forget to use a trailing sell stop of 12%, or less if you’re feeling nervous.
If some of these words sound like Greek to you, please check out the Glossary of Terms and new subscriber information in section 9.
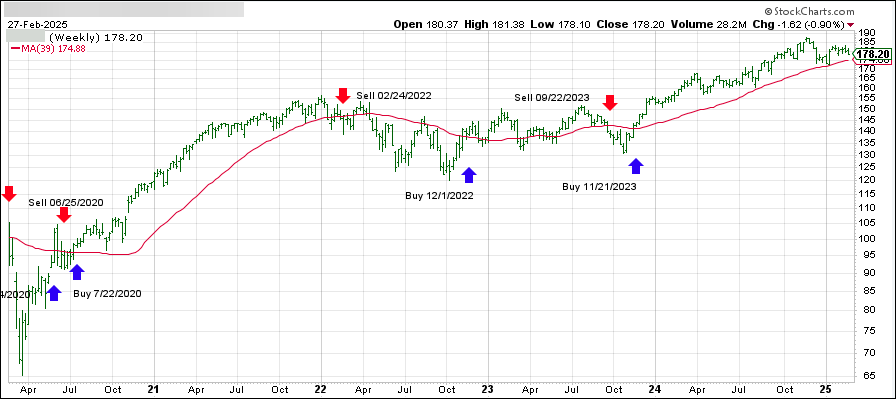
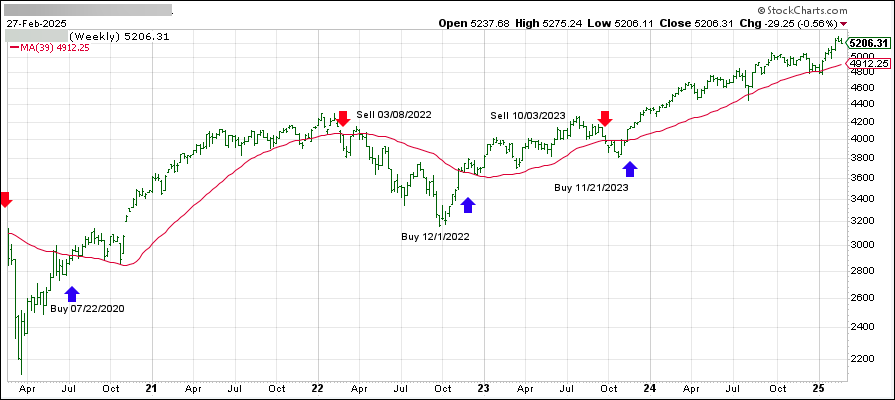
DOMESTIC EQUITY ETFs: BUY— since 11/21/2023
Click on chart to enlarge
This is our main compass, the Domestic Trend Tracking Index (TTI-green line in the above chart). It has broken above its long-term trend line (red) by +2.11% and is in “Buy” mode as posted.
The link below shows all High Volume (HV) Domestic Equity ETFs. They are ranked by M-Index, which is my secret sauce for measuring momentum. Prices in all linked tables below are updated through 02/27/2025, unless otherwise noted. Price data not yet available at publication is indicated with 00.00% or -100.00%. Please note that distributions are not included in the current momentum numbers.
If the TTI is above the trend line, you can use the tables in the link below to pick your winners:
This is our global guide, the International Trend Tracking Index (green). It has now moved +6.26% above its long-term trend line (red) and is in “Buy” mode as indicated.
The list in the link below shows the High Volume (HV) International ETFs I track for you during a Buy cycle. They are also ranked by M-Index:
This is the mother of all lists, showing all ETFs I track and how they stack up against each other. The sorting order is by M-Index too. Momentum figures for all ETFs are not adjusted for dividends.
This is where you can find HV ETFs for specific countries or regions that I watch every week. Please note that the data in this table does not include adjustments due to distributions. Country funds can be wild beasts, so make sure you use a trailing stop loss (I use 10%) to protect yourself from nasty bites.
This is where you can diversify your portfolio by looking for different opportunities in various sectors of the market. The table of HV Sector ETFs in the following link covers a wide range of possibilities. The sorting order is by M-Index:
Here too, I recommend using a 10% trailing stop loss to limit your risk.
BOND & DIVIDEND ETFs: SELECTIVE BUY
If you like getting paid for holding ETFs, here’s a list of bond and dividend paying ETFs. But before you buy them, make sure you check their momentum figures first. Then you can visit your favorite financial web site to see their yield and other details.
Please note that the data in this table does not include adjustments due to distributions.
Please note that some of these funds try to beat the index they are tied to by a certain percentage. This can boost your returns, but it can also magnify your losses. So be careful and use a trailing sell stop (I suggest 10%) and be ready for some bumps along the way.
NEW SUBSCRIBER INFORMATION
To get a head start on more successful investing, please click on:
In case you missed it, you can download my latest e-book “How to beat the S&P 500…with the S&P 500,” here. If you are investing your 401k and must use mutual funds, I suggest you mainly stick with the S&P 500 as described in my book. Of course, you can always use the above tables to find sector or country ETFs that suit your taste and use the equivalent mutual funds as offered by your custodian.
Disclosure:
I must tell you that I, as well as my advisory clients, own some of the ETFs listed in the above table. Also, they are not meant to be specific investment recommendations for you, they just show which ETFs from my universe are doing well right now.

