
ETF Tracker StatSheet
You can view the latest version here.
DOW CHARGES AHEAD: BEST WEEK OF THE YEAR DESPITE TODAY’S SLIP
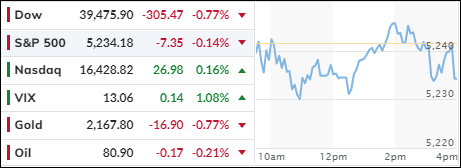
[Chart courtesy of MarketWatch.com]
- Moving the markets
Despite a slight dip in today’s session, the stock market maintained its upward trajectory, with the Dow Jones Industrial Average charging towards its most impressive week of the year. The three major indexes all posted robust gains: the S&P 500 surged by 2.3%, the Nasdaq climbed 2.8%, and the Dow led the pack with a 2.1% increase, marking its strongest performance since December.
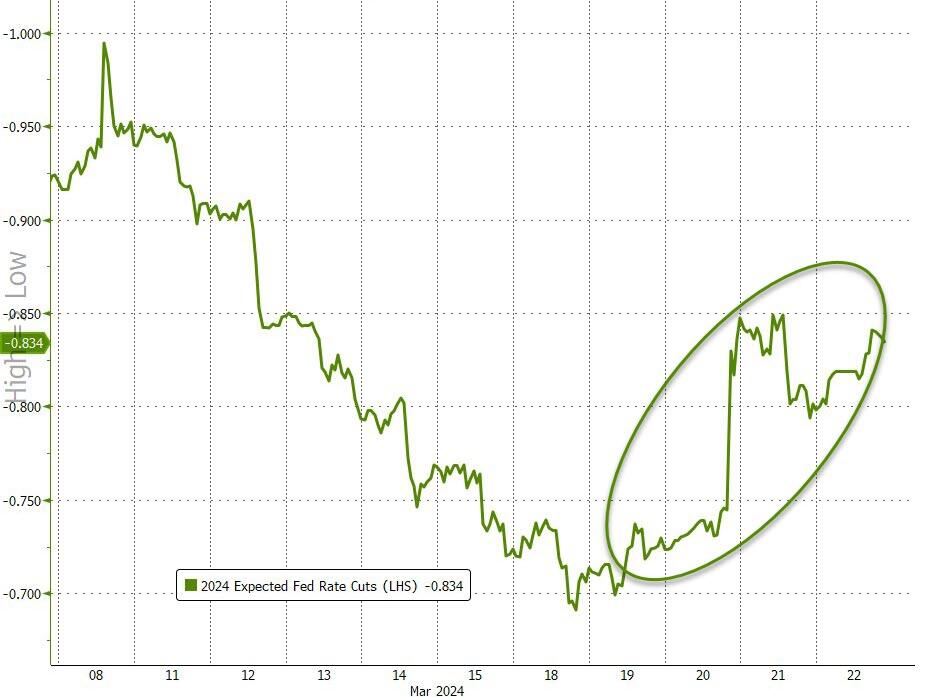
The market’s overall trend remains bullish, highlighted by a series of new highs and on course for a fifth straight month of growth. This week’s Federal Reserve meeting contributed to the optimism, as the central bank held interest rates steady. Fed Chair Powell’s remarks suggested that rate cuts are on the horizon, despite recent high inflation figures that had some investors bracing for a delay in monetary easing. This assurance was sufficient to propel the market forward.
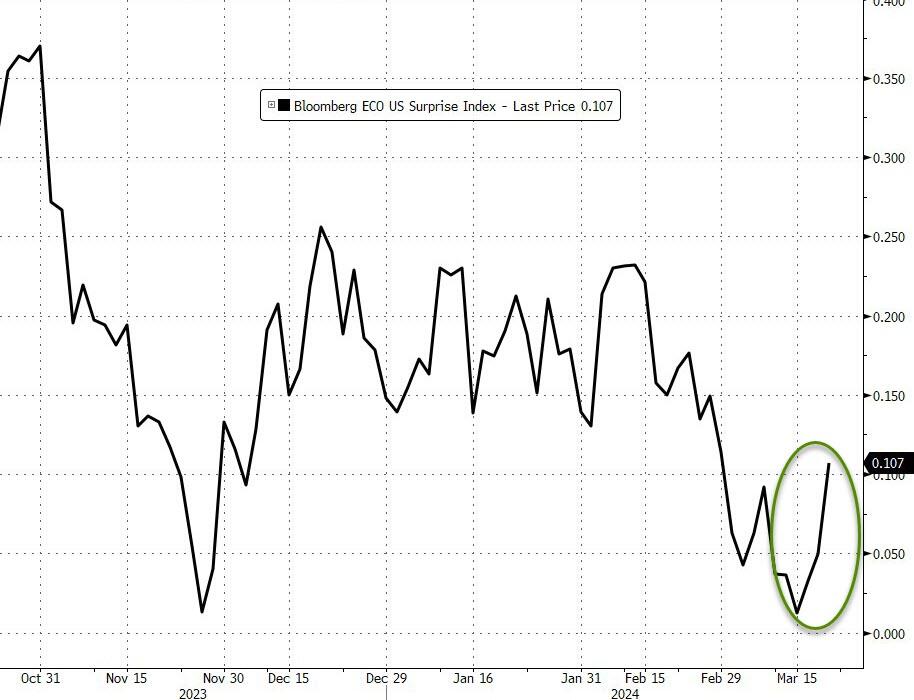
While the markets seem to be riding a wave of enthusiasm, it’s worth noting that the Fed’s comments don’t guarantee a rate cut in June. Nonetheless, the Economic Surprise Index is on the rebound, and expectations for a rate reduction are mounting. Consequently, it’s no shock to traders that stocks have soared to new heights, with all major indexes wrapping up a strong week, led by the Nasdaq’s performance.
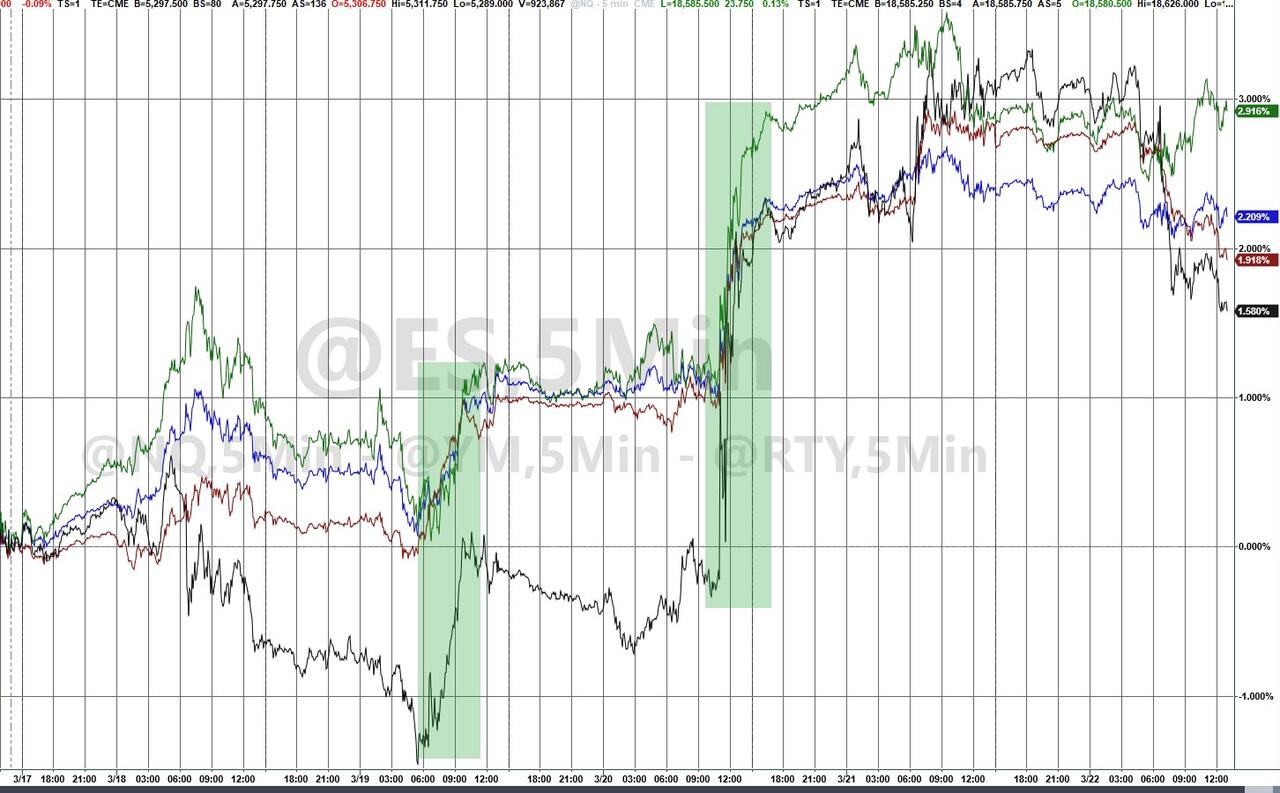
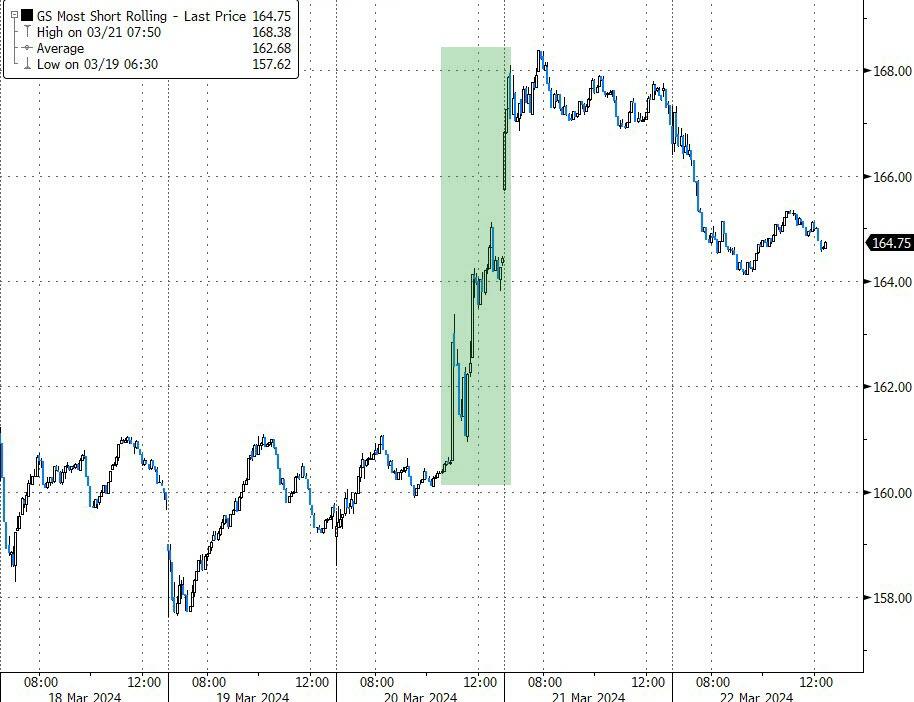
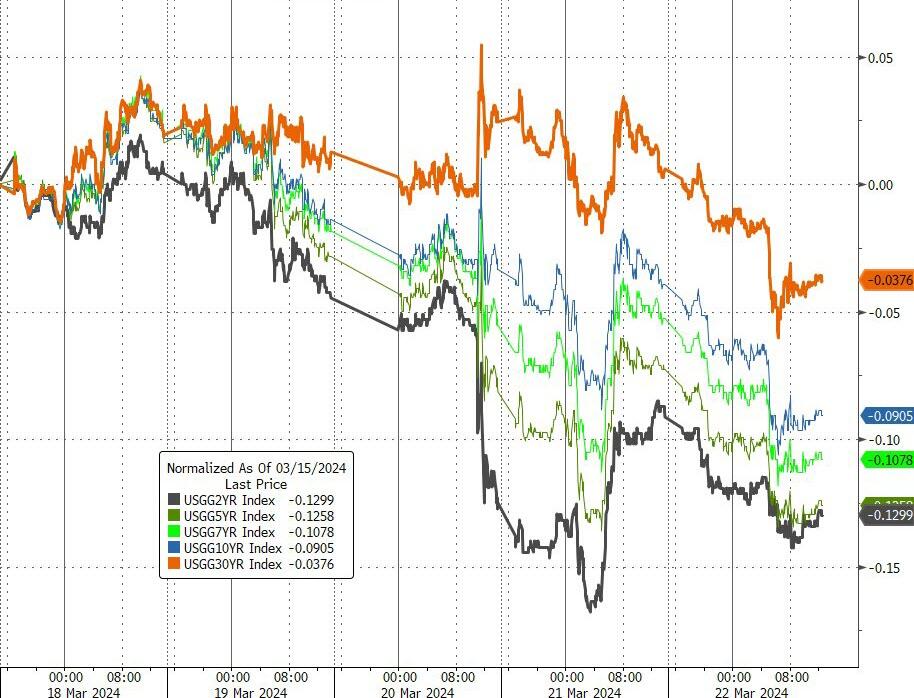
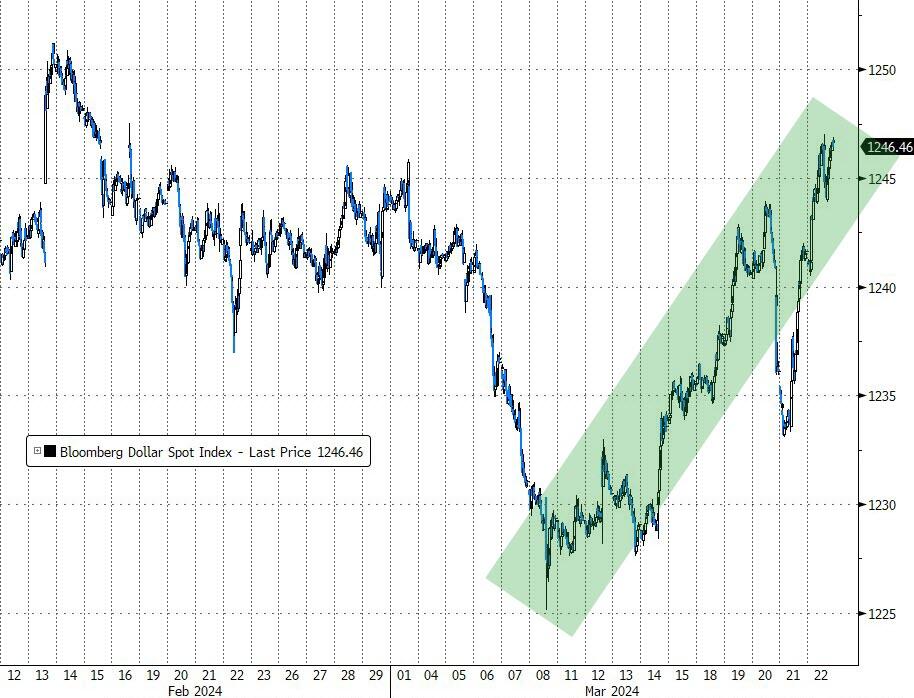
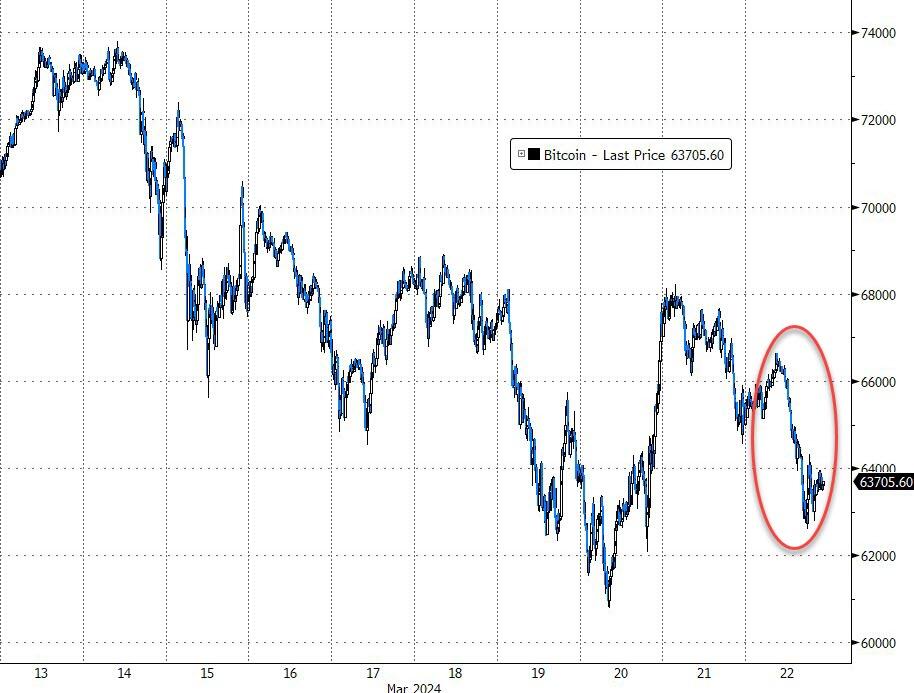
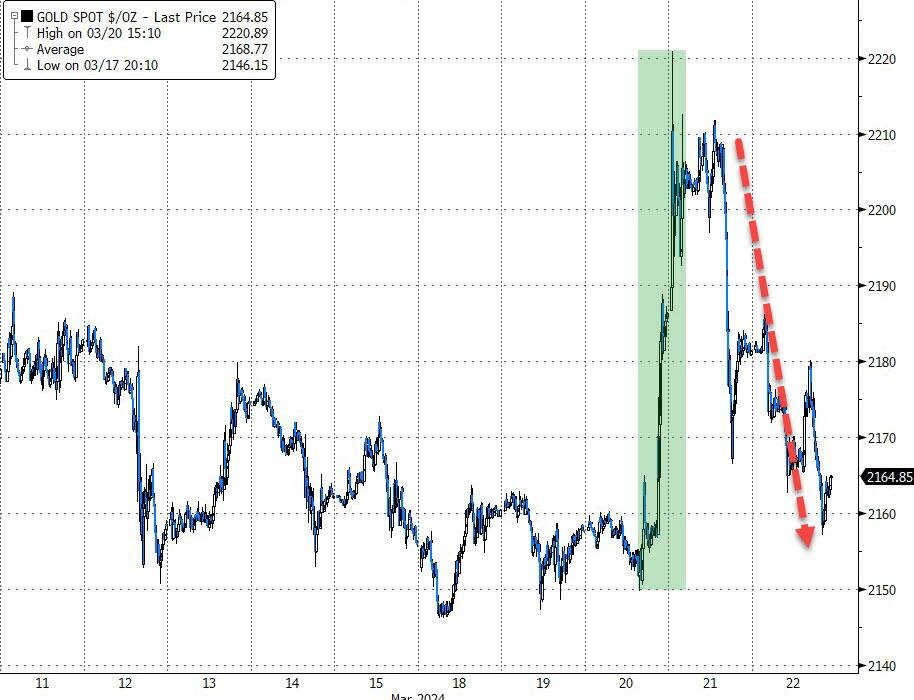
Midweek saw an intense short squeeze that eventually fizzled out, resulting in a subdued finish. Meanwhile, falling bond yields lent support to the markets, the dollar surged to a six-week peak, and Bitcoin held steady around the $64k mark. Gold hit a record high early in the week but retreated to close nearly unchanged, mirroring crude oil’s trajectory after its peak on Tuesday.
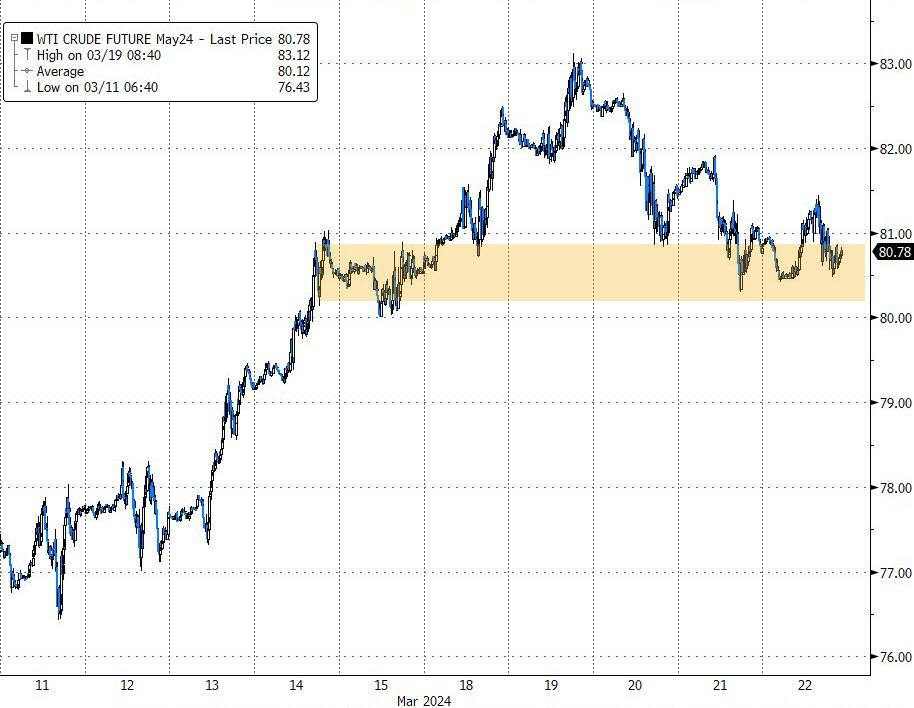
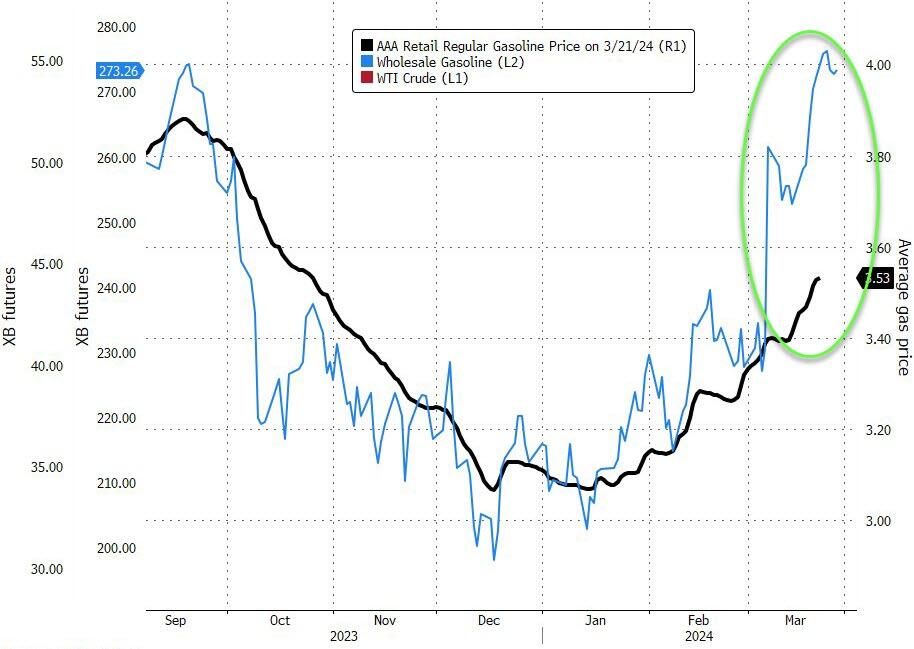
However, the recent surge in crude oil prices, now over $80, could spell trouble if the trend persists. Rising fuel costs may negatively impact the upcoming Consumer Price Index (CPI) report and influence the Federal Reserve’s decision on whether to implement a rate cut in June.
2. Current “Buy” Cycles (effective 11/21/2023)
Our Trend Tracking Indexes (TTIs) have both crossed their trend lines with enough strength to trigger new “Buy” signals. That means, Tuesday, 11/21/2023, was the official date for these signals.
If you want to follow our strategy, you should first decide how much you want to invest based on your risk tolerance (percentage of allocation). Then, you should check my Thursday StatSheet and Saturday’s “ETFs on the Cutline” report for suitable ETFs to buy.
3. Trend Tracking Indexes (TTIs)
Although today’s trading session lacked clear direction and was somewhat disorganized, the major stock indexes, particularly the Nasdaq, ended the week on a positive note.
Our TTIs experienced a slight decline; however, they continue to be firmly positioned in bullish territory, well above their trend lines.
This is how we closed 3/22/2024:
Domestic TTI: +10.85% above its M/A (prior close +11.55%)—Buy signal effective 11/21/2023.
International TTI: +10.37% above its M/A (prior close +11.10%)—Buy signal effective 11/21/2023.
All linked charts above are courtesy of Bloomberg via ZeroHedge.
———————————————————-
WOULD YOU LIKE TO HAVE YOUR INVESTMENTS PROFESSIONALLY MANAGED?
Do you have the time to follow our investment plans yourself? If you are a busy professional who would like to have his portfolio managed using our methodology, please contact me directly to get more details.
—————————————————————-
Contact Ulli