Bitcoin And Gold Rally As Equities End In The Red

Ulli Market Commentary Contact

[Chart courtesy of MarketWatch.com]

  1. Moving the market

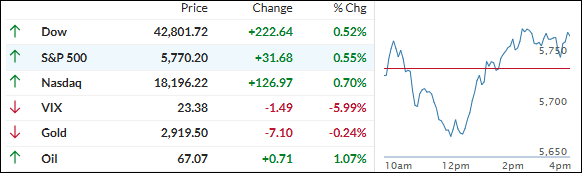
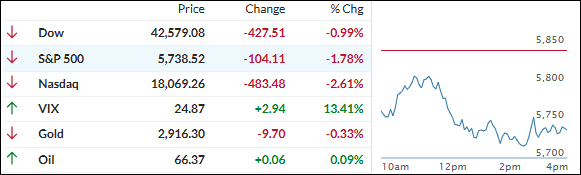
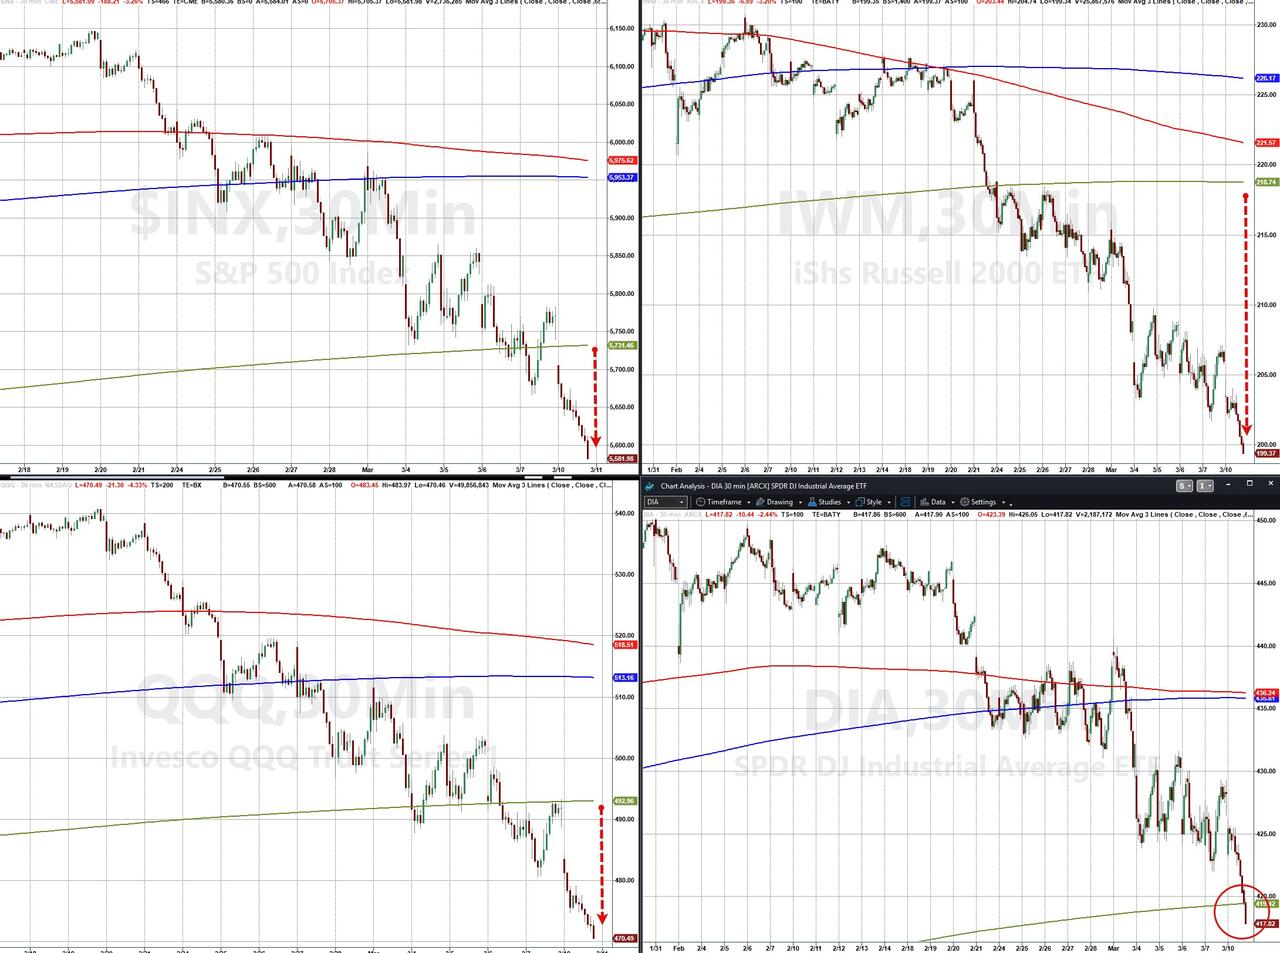
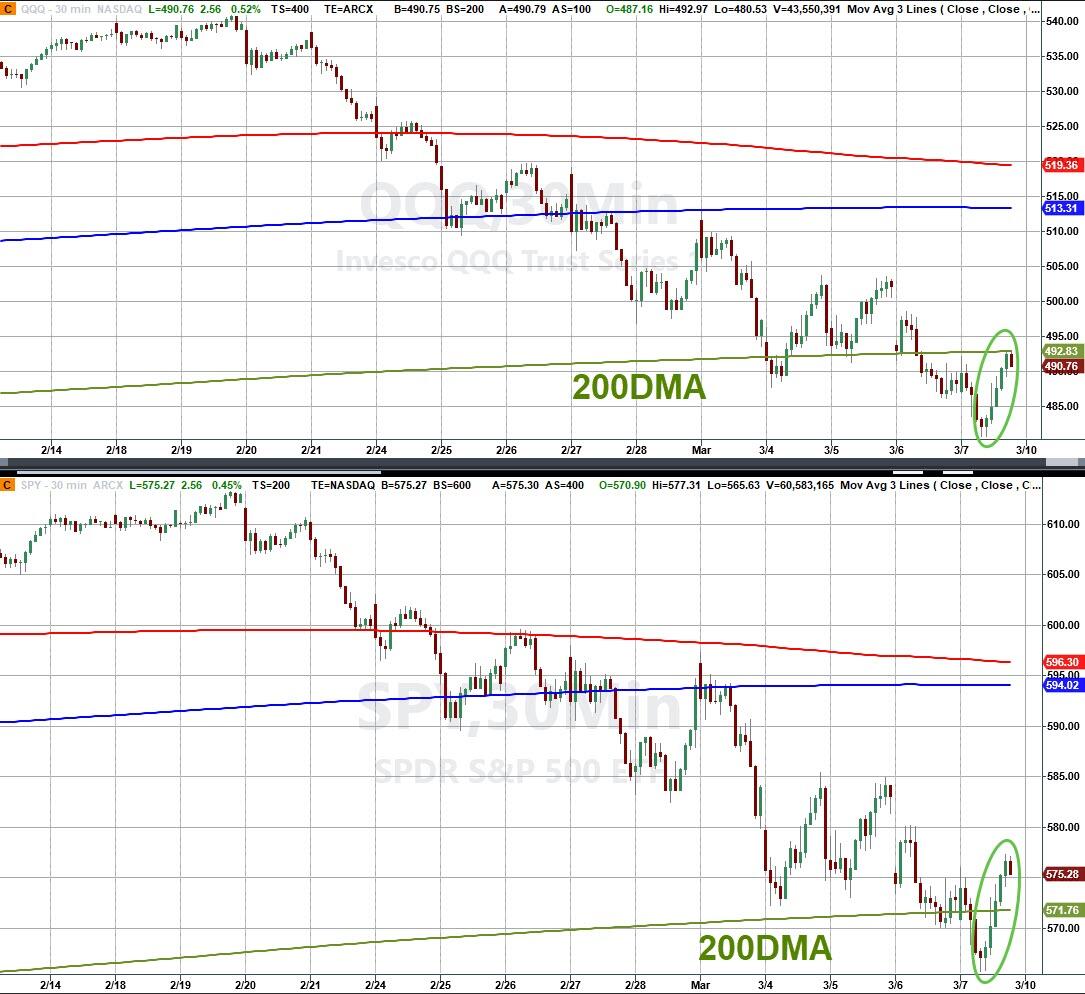
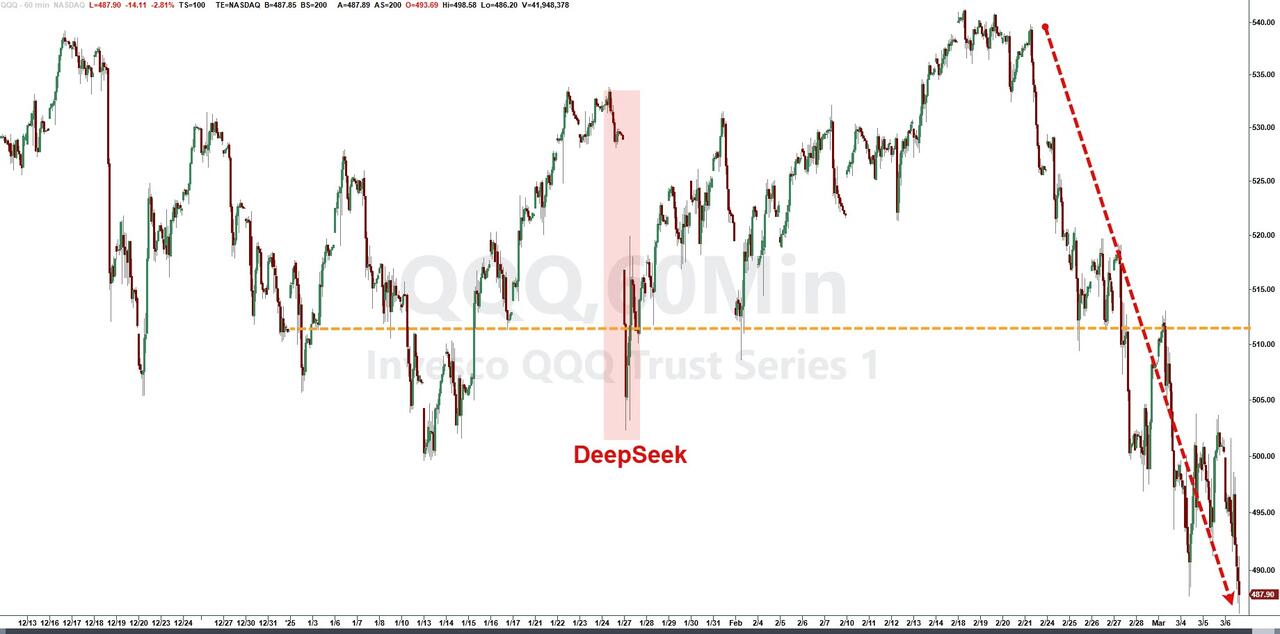
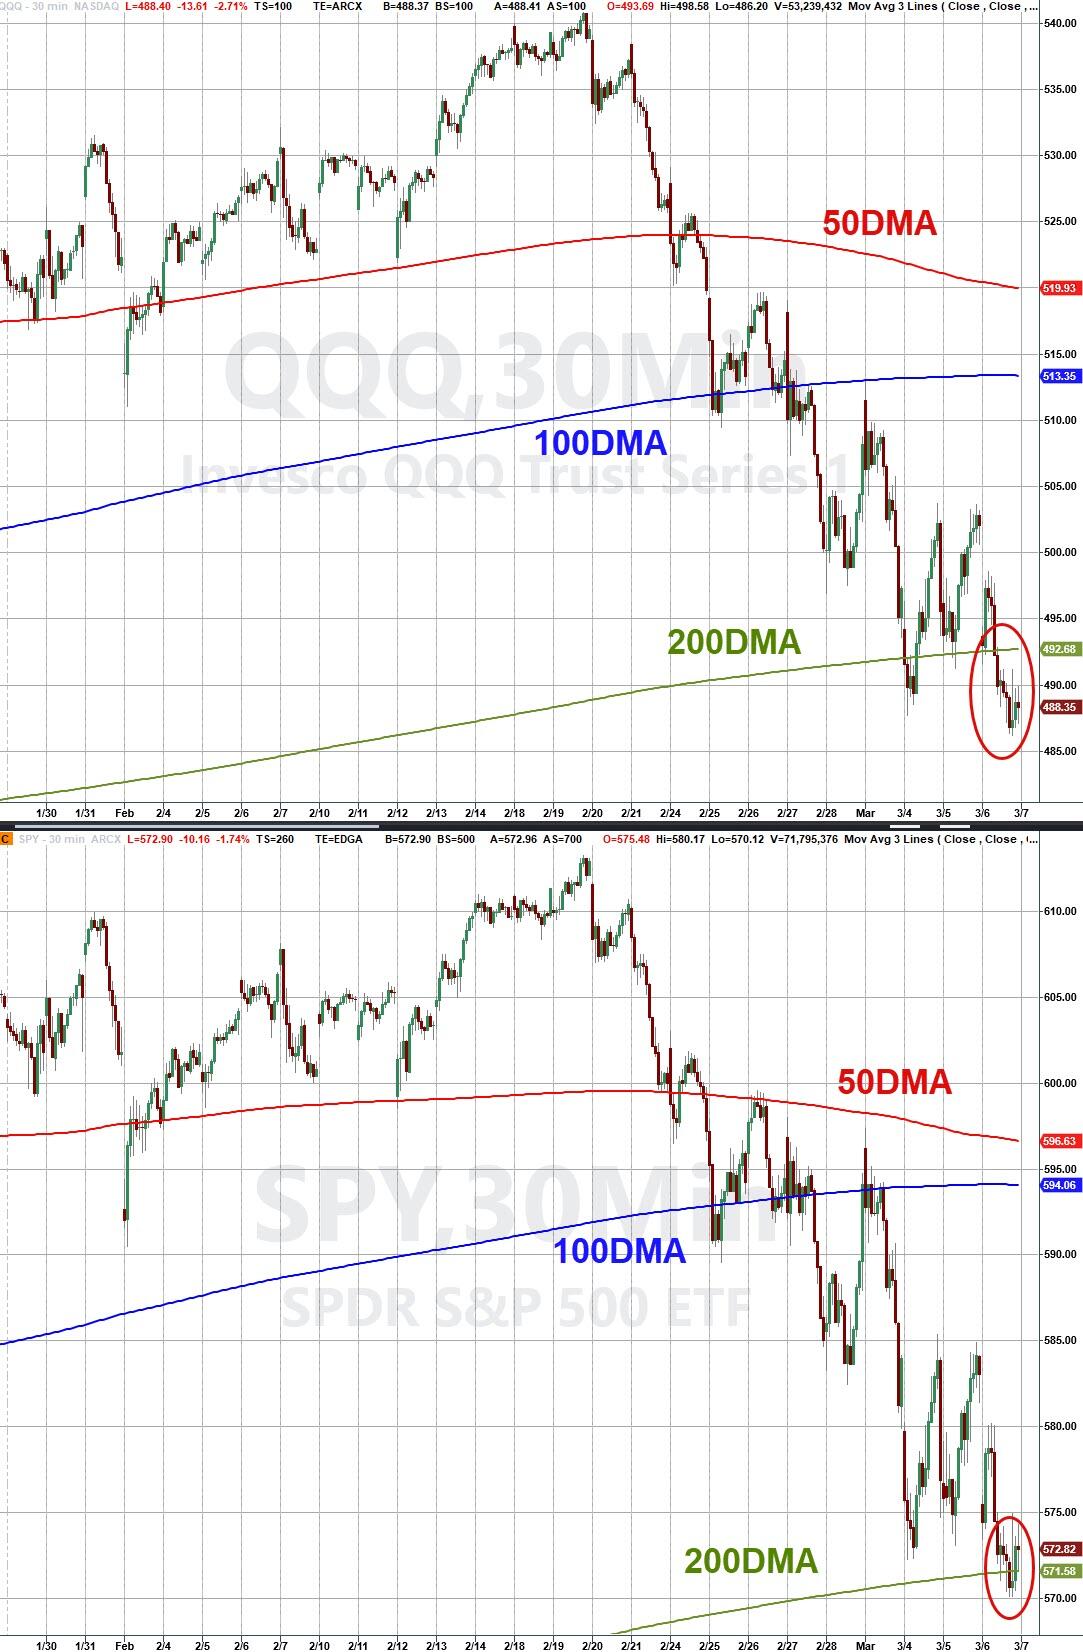
After a brief early bounce, the major indexes resumed their downward trend from yesterday. The S&P 500 made two attempts to reclaim its unchanged line but ultimately failed to hold on.

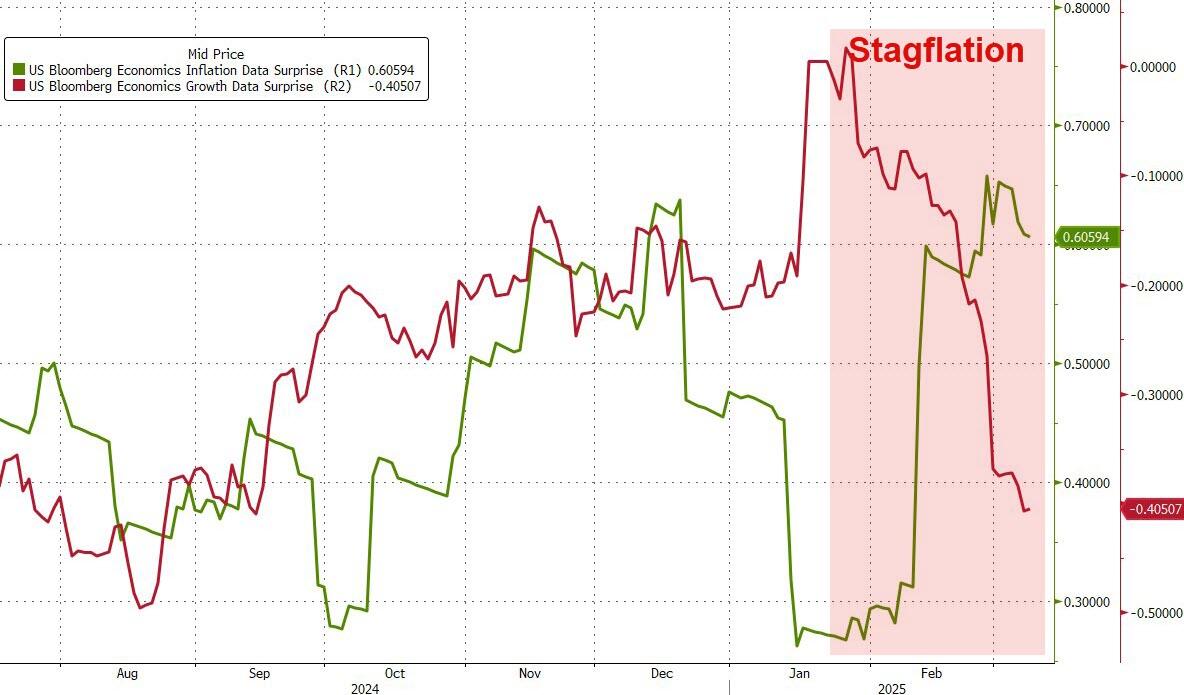
In a post, Trump announced that additional tariffs of 25% on Canada and Mexico would take effect on Wednesday, targeting steel and aluminum. When asked about a potential recession, he described the economy as going through a “period of transition.”

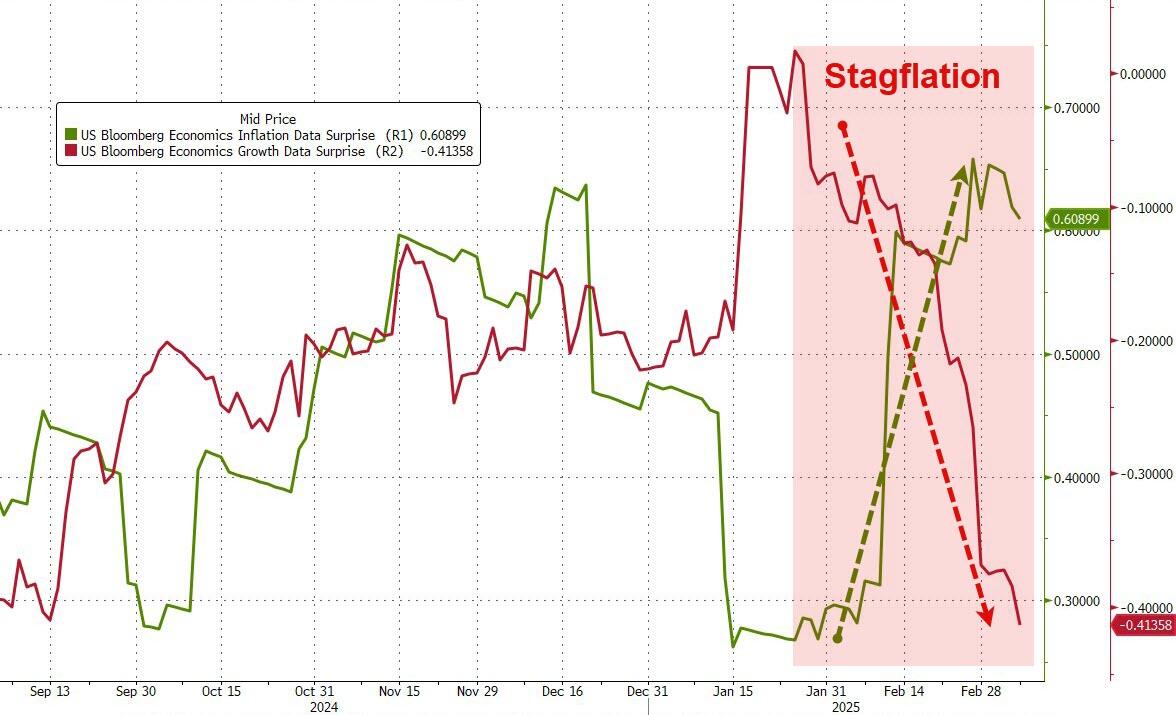
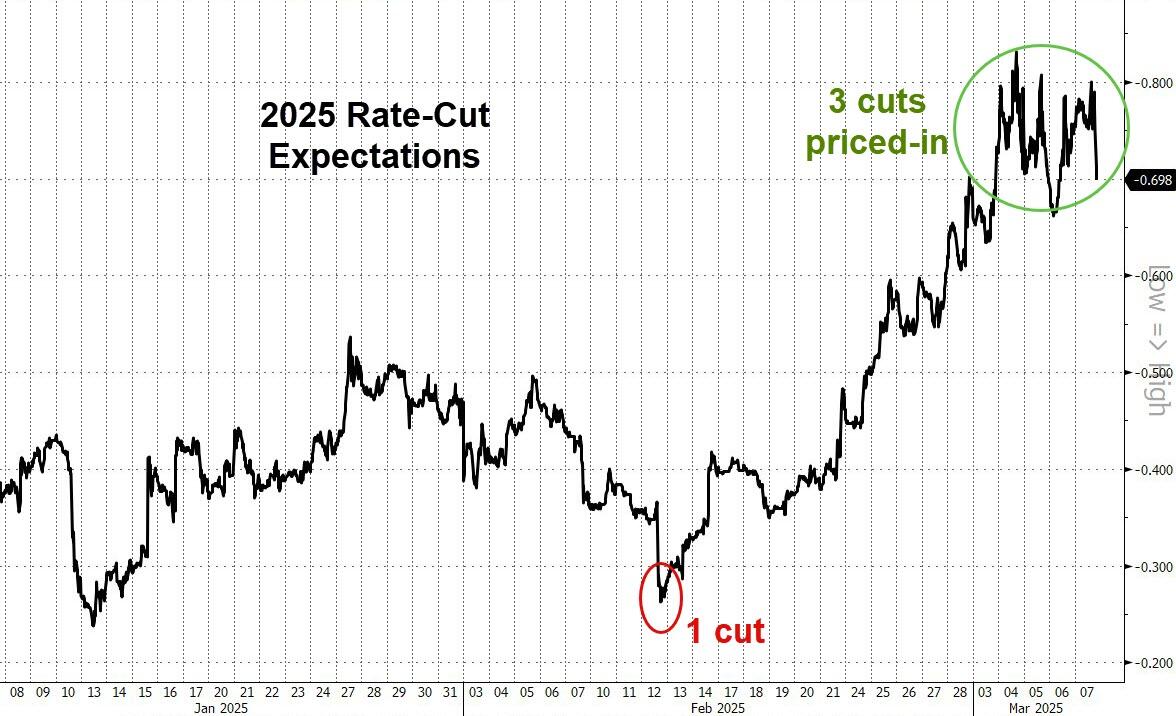
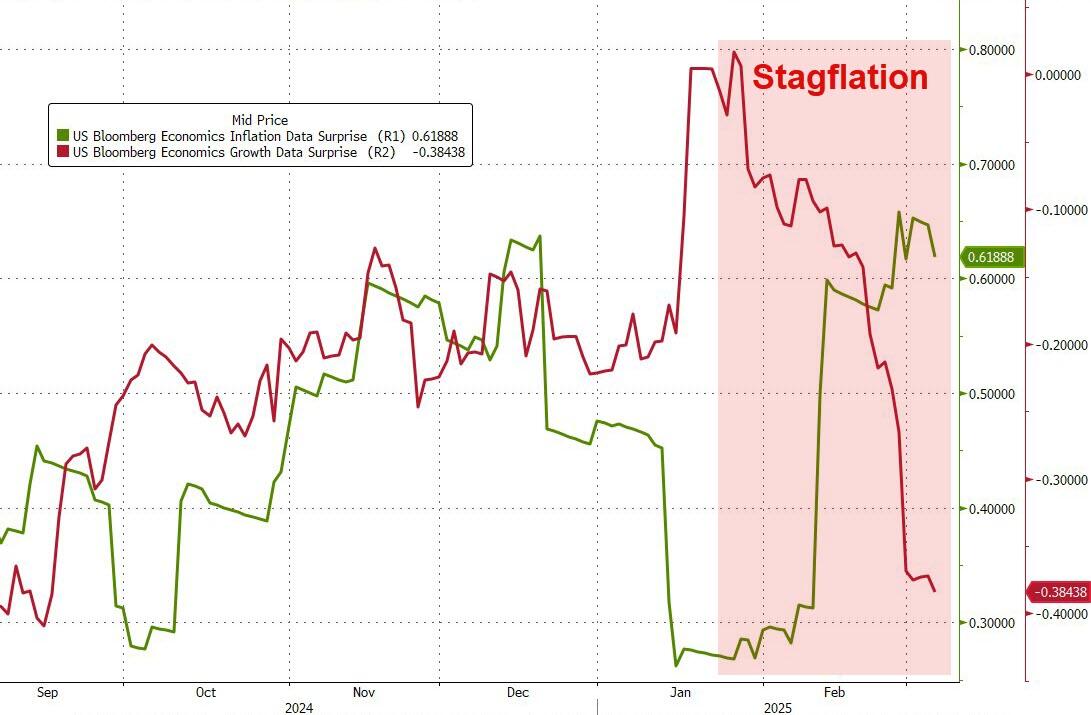
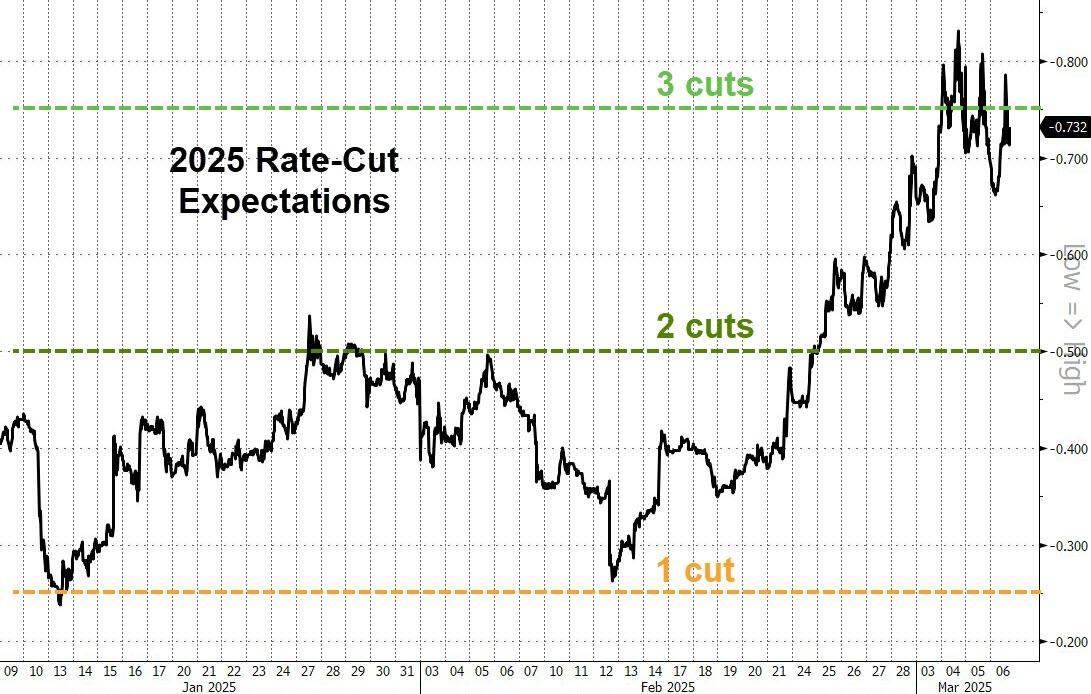
Traders were spooked, escalating fears of an economic recession, which would negatively impact equities. Consequently, Citigroup downgraded its rating on U.S. stocks from overweight to neutral.

Delta Airlines also slashed its earnings outlook due to weaker demand, causing their stock to drop by about 5%, further contributing to negative market sentiment.

An afternoon rebound helped equities recover from their worst levels, but the session still ended with a moderate decline.

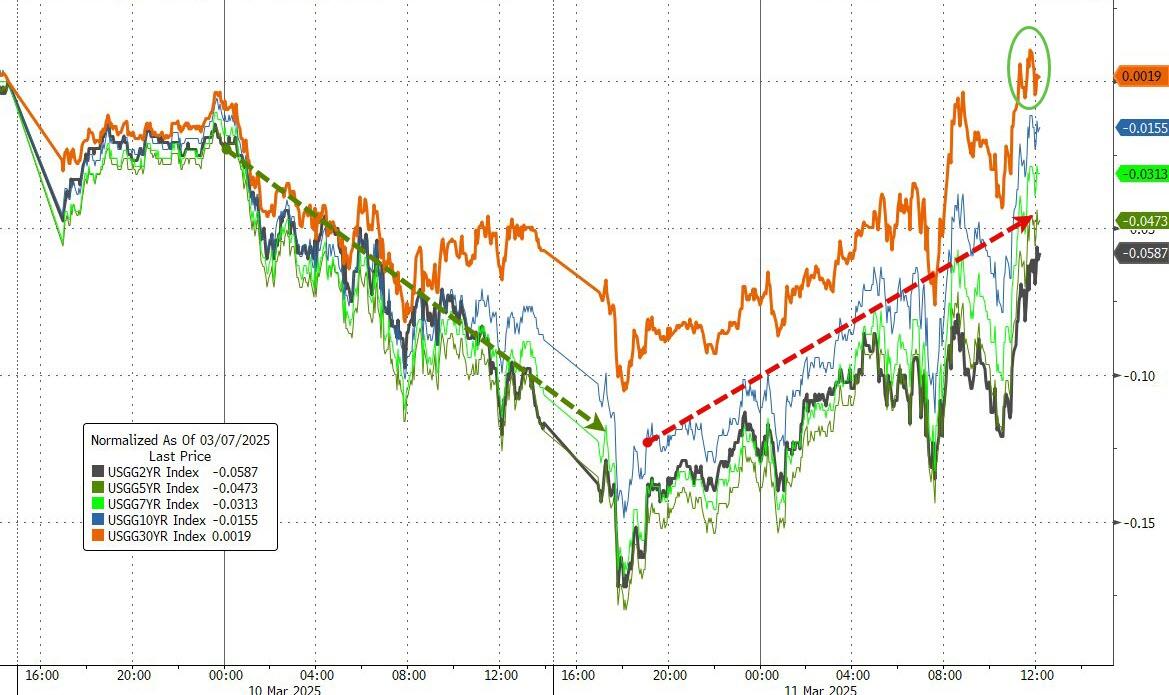
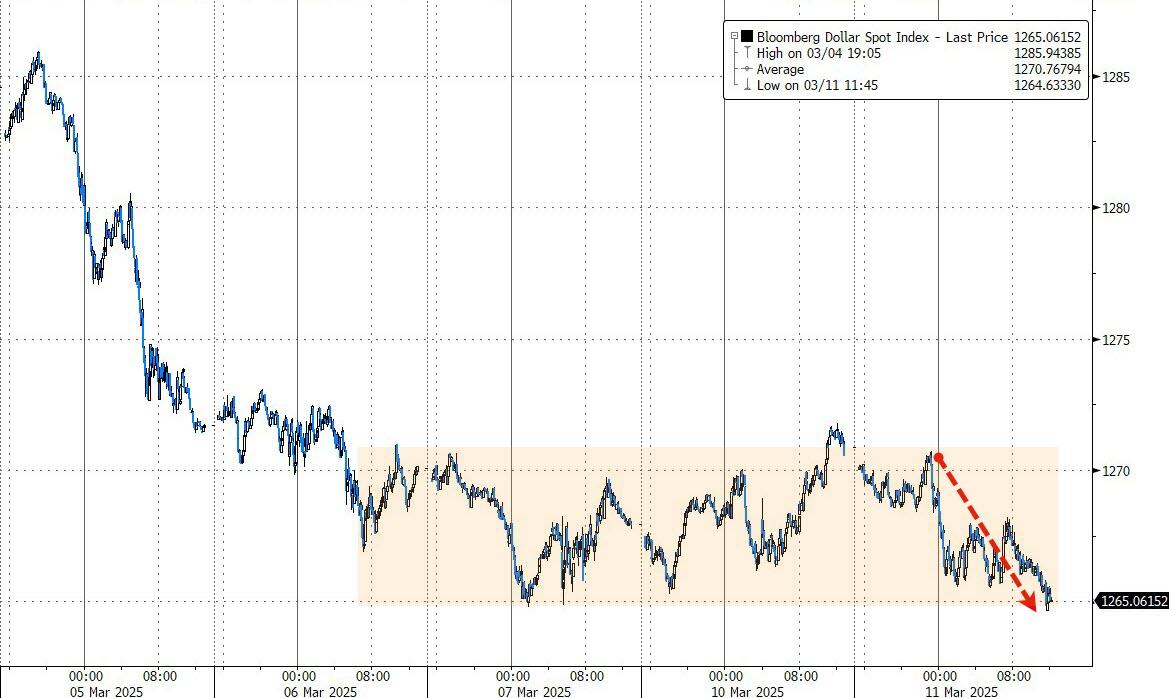
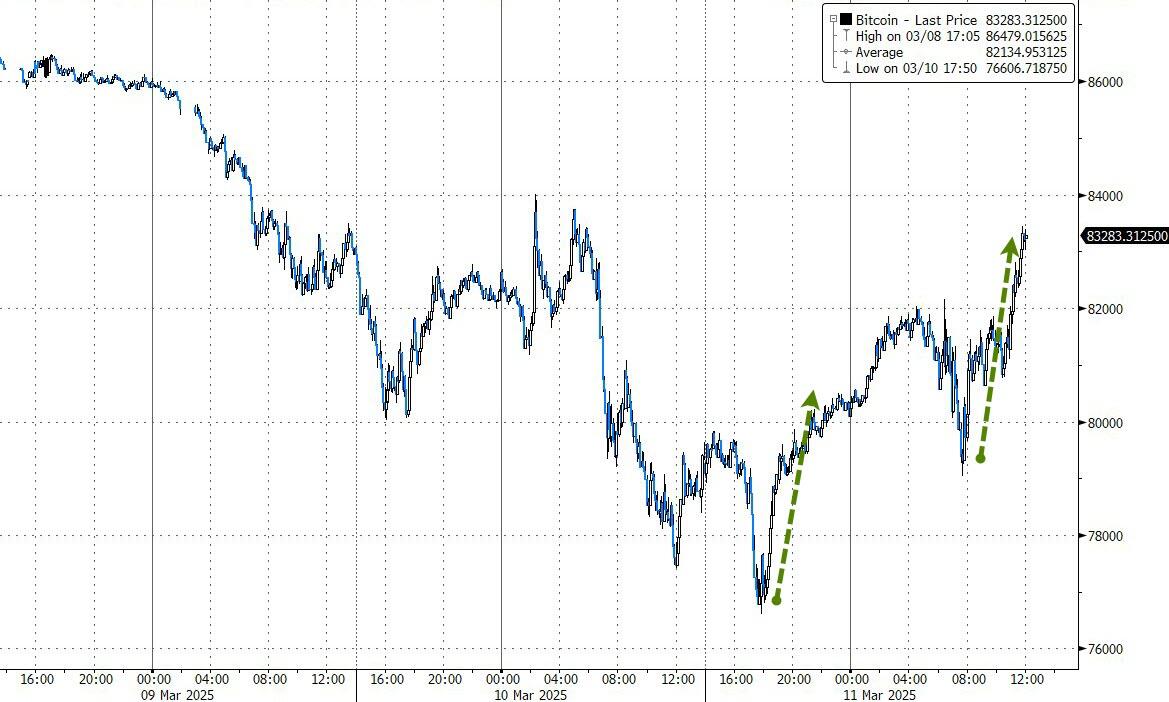
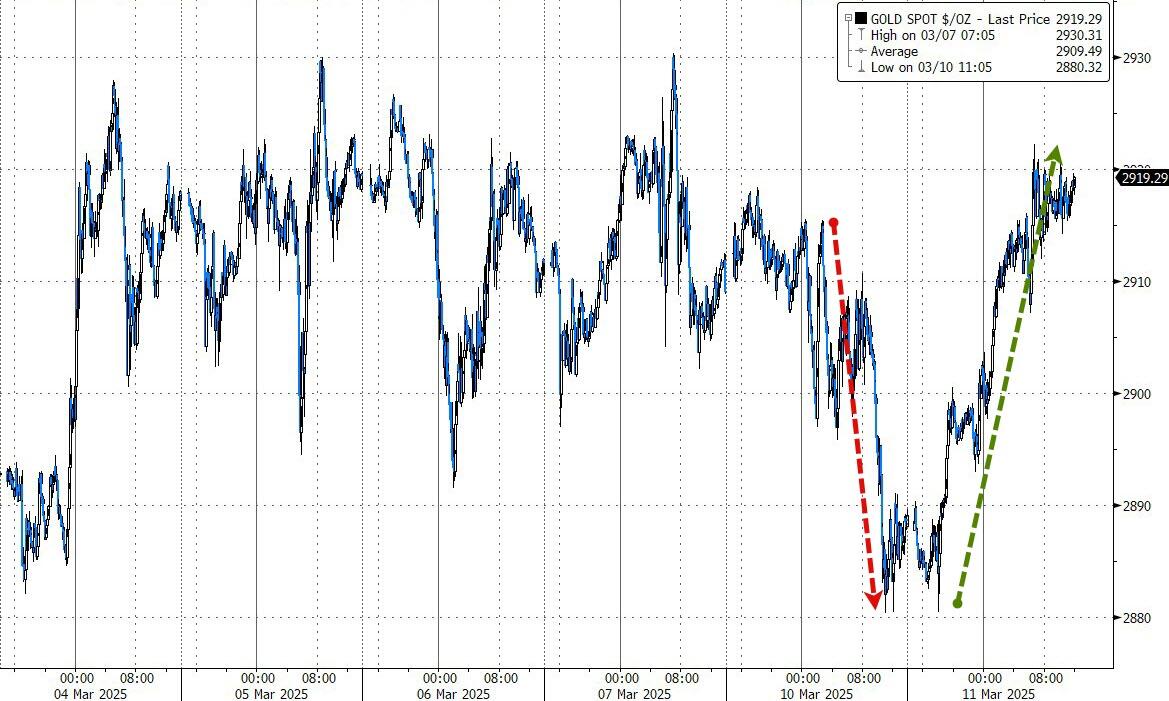
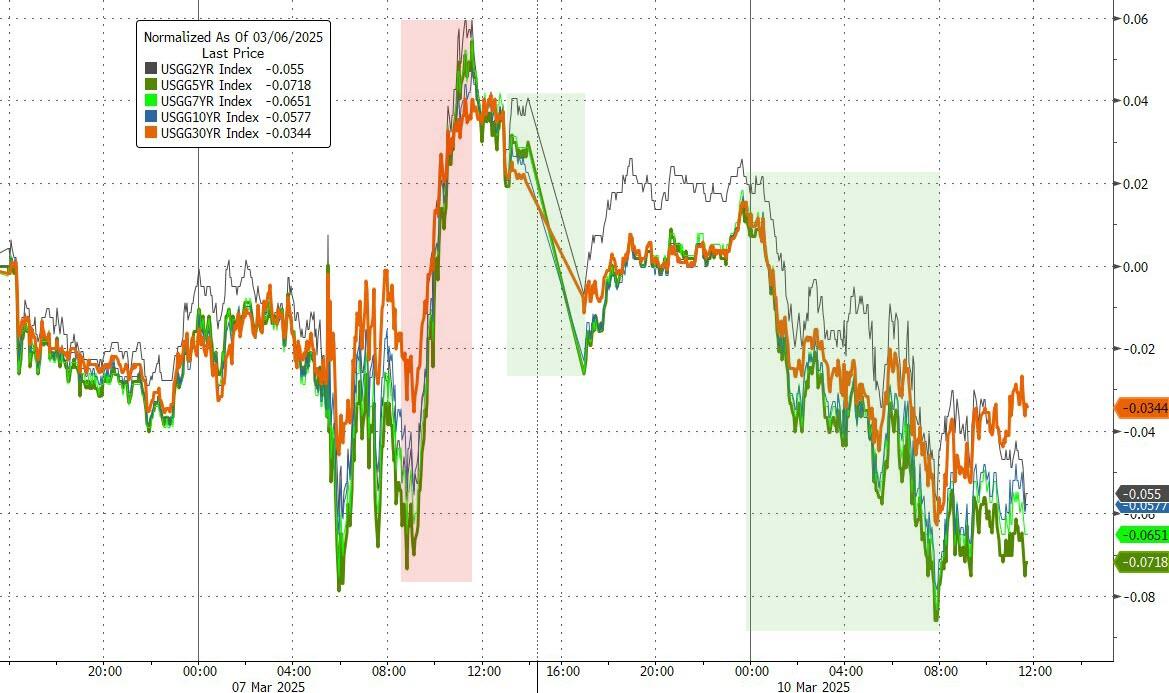
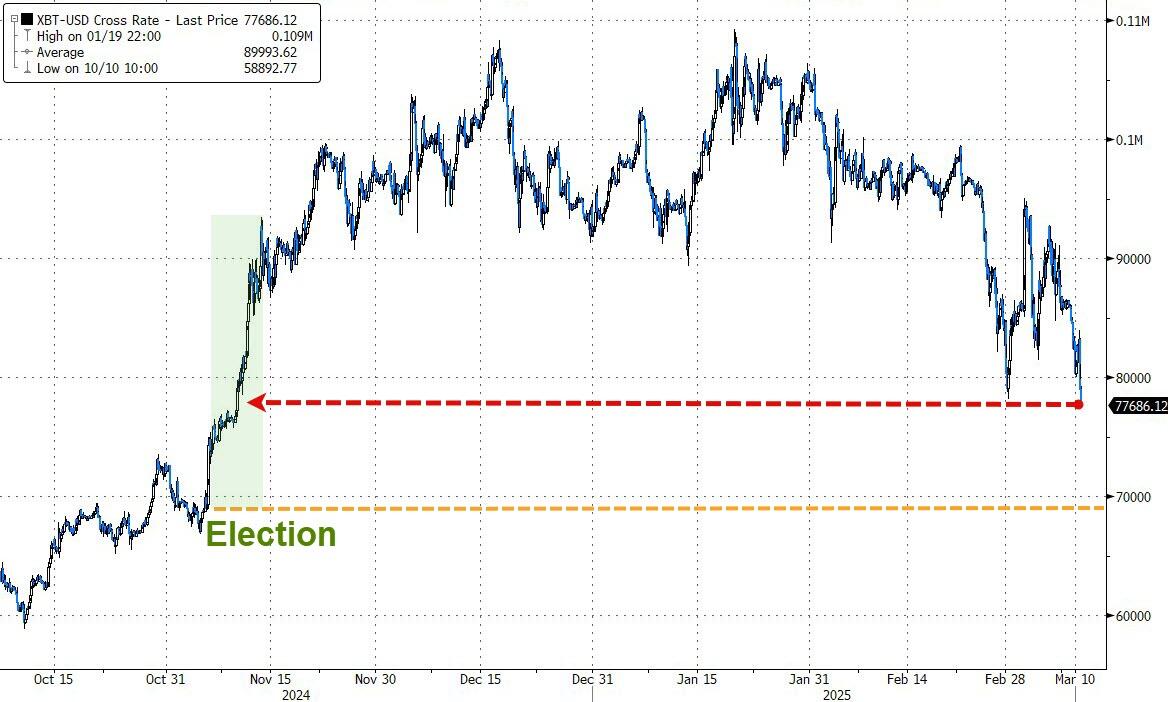
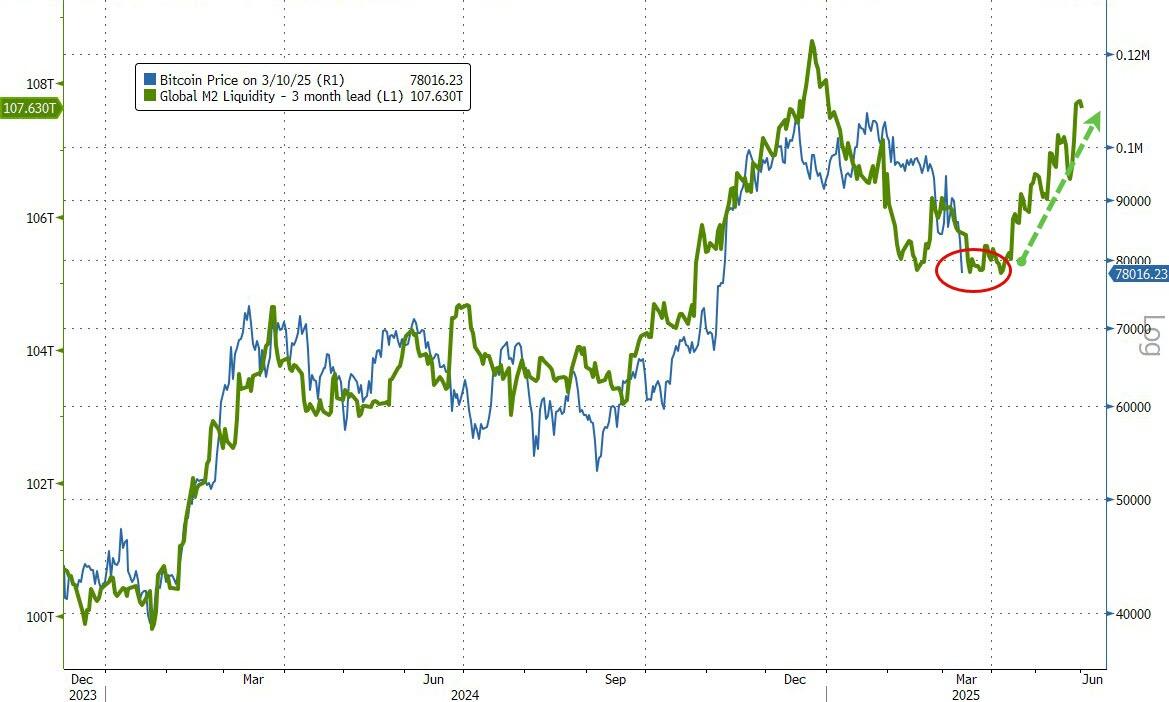
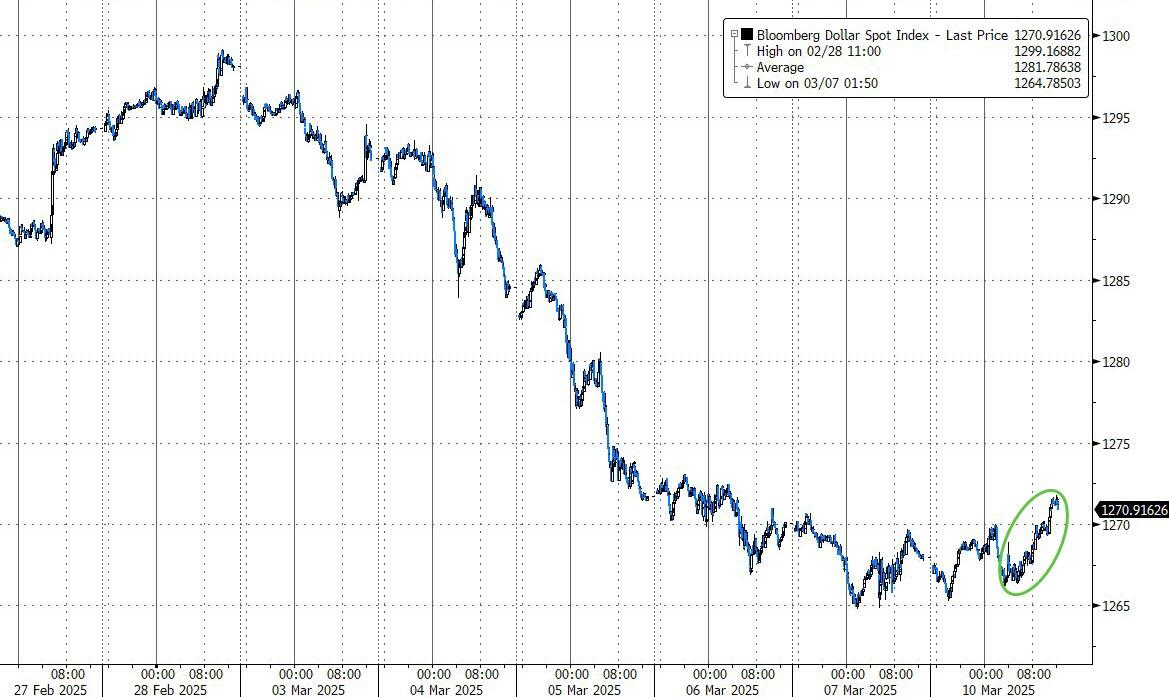
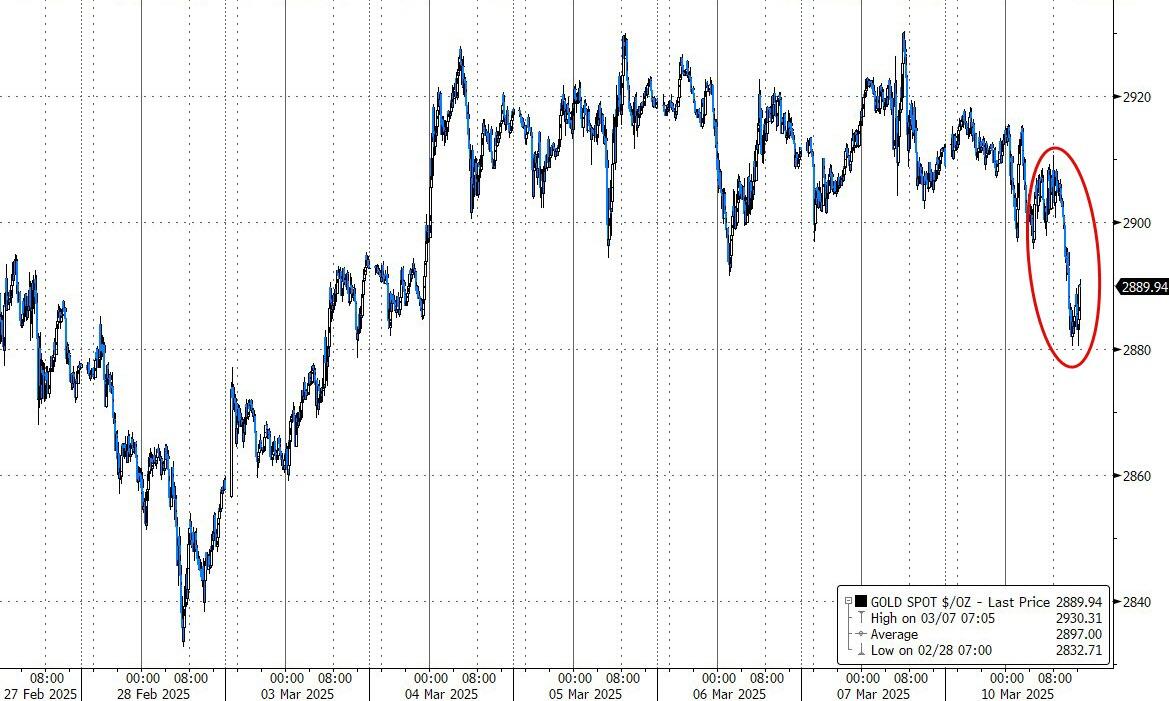
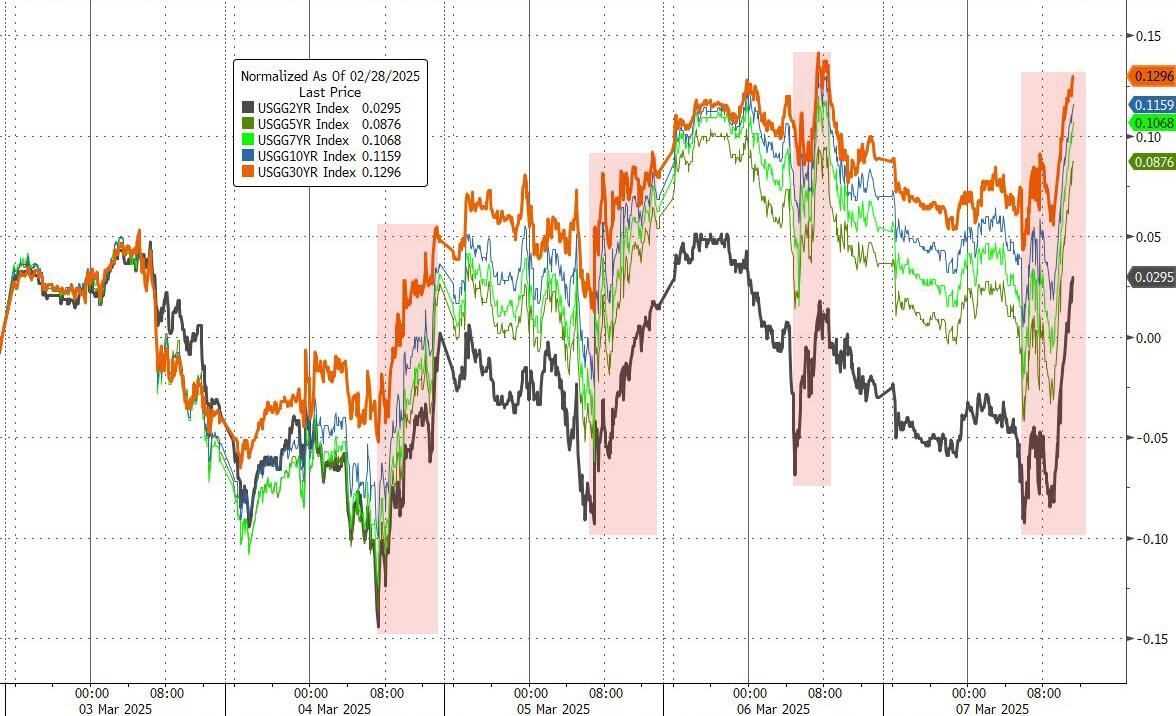
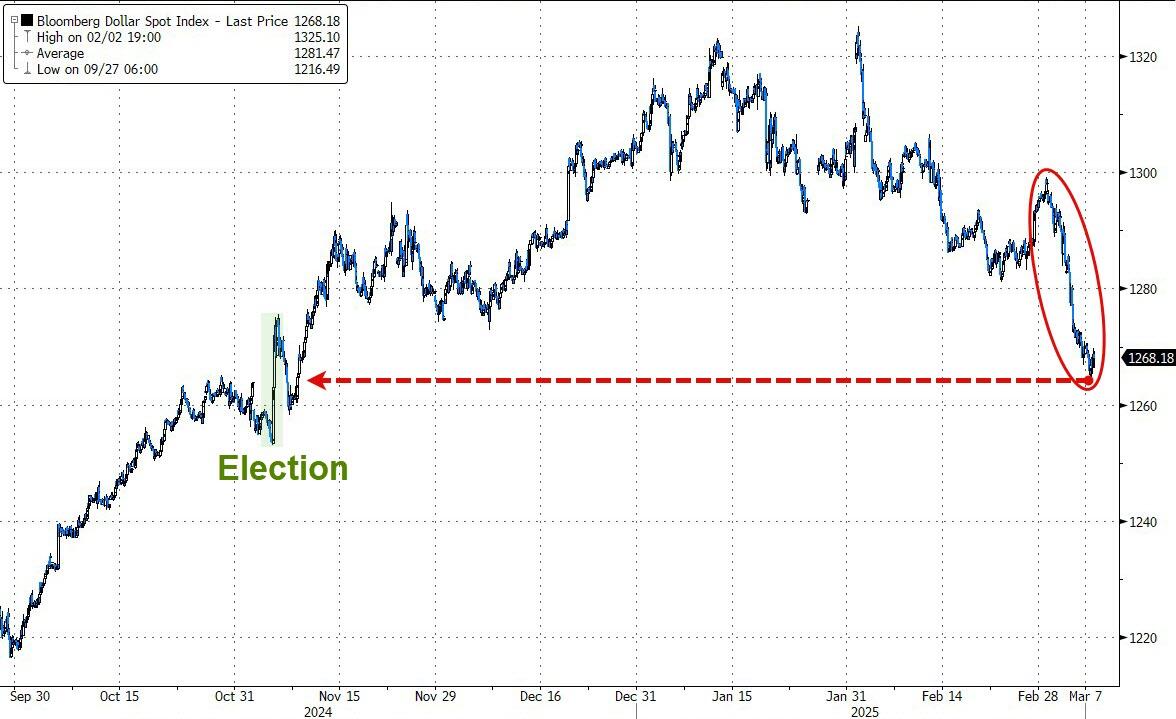
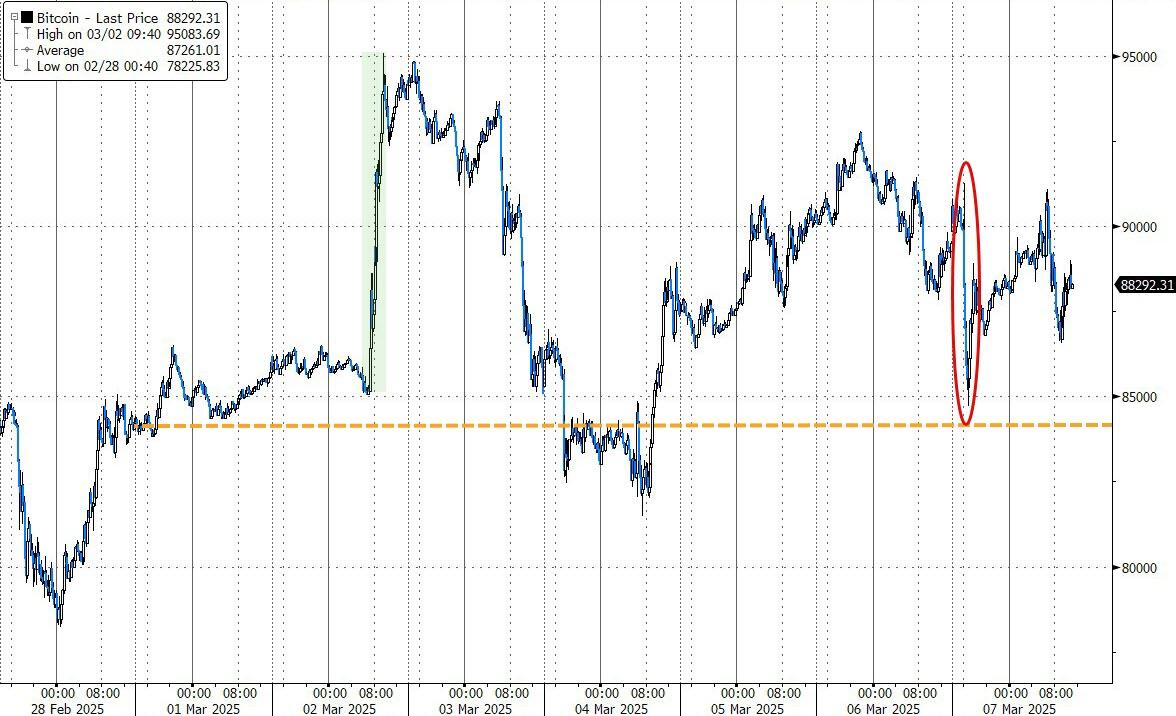
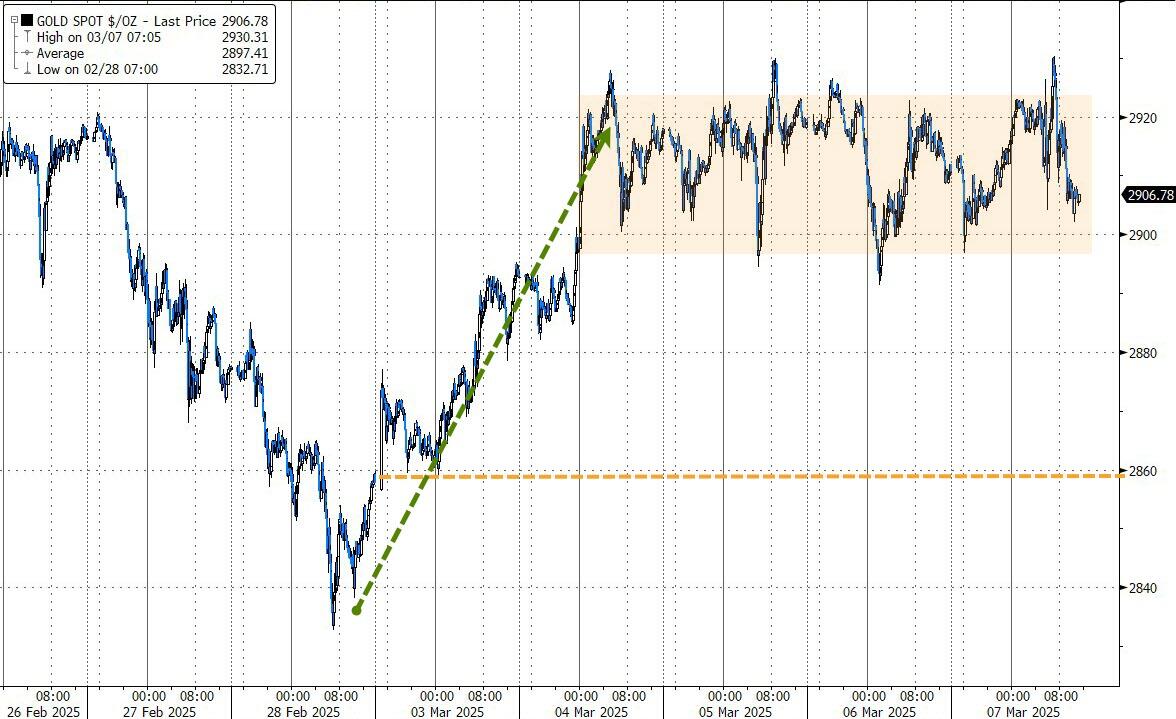
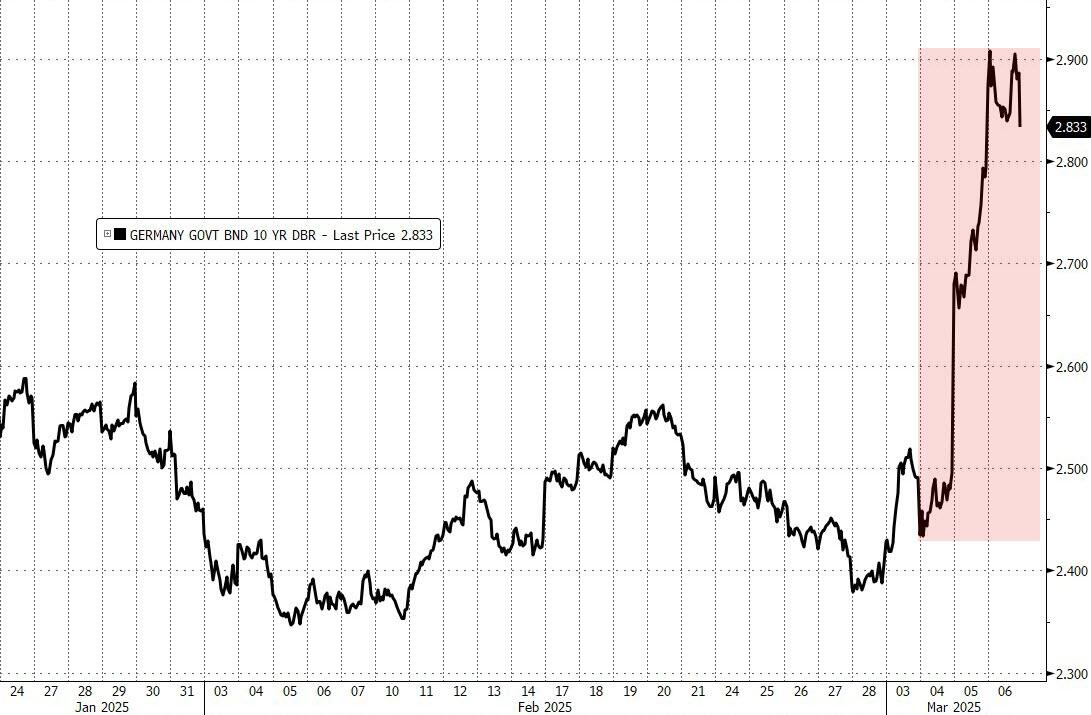
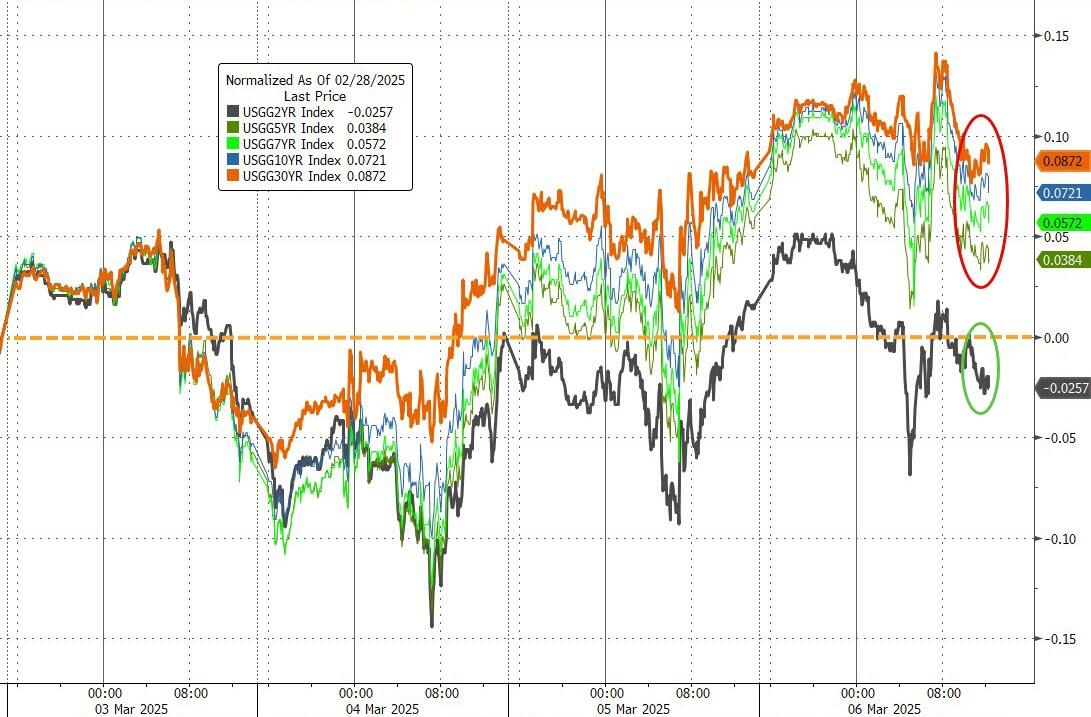
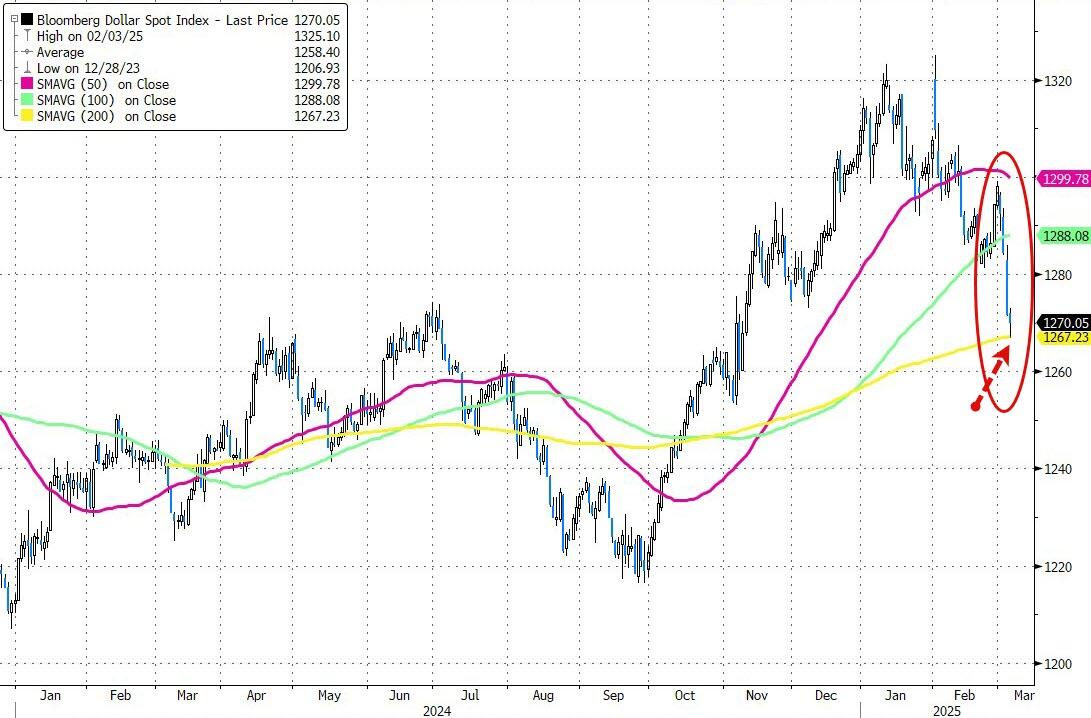
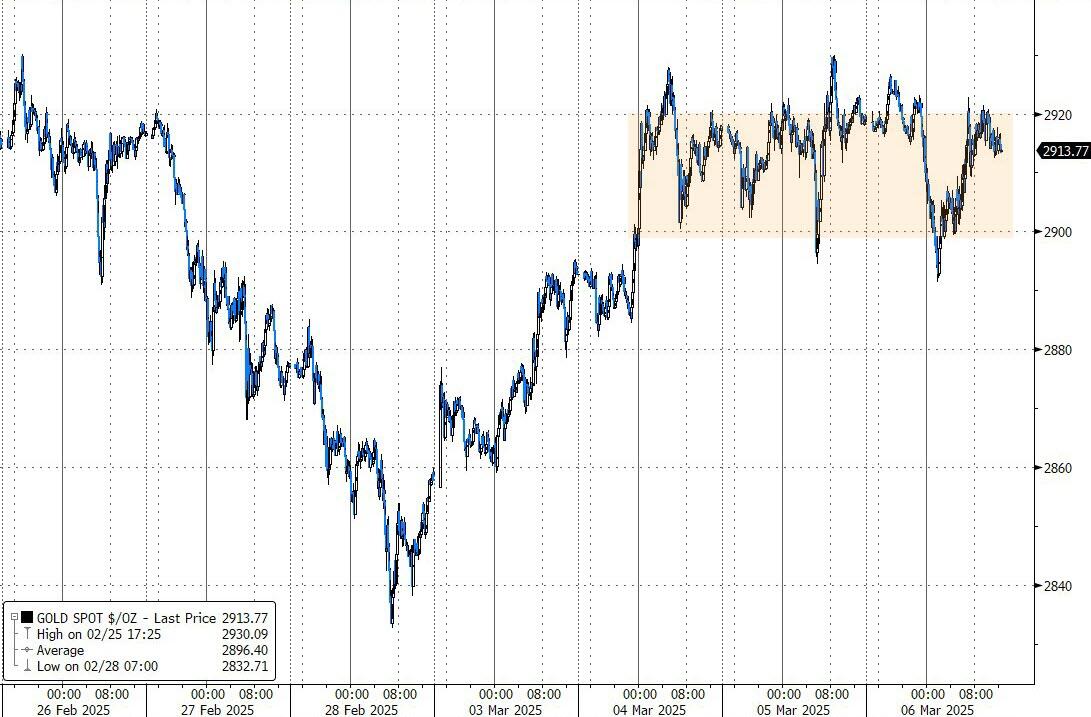
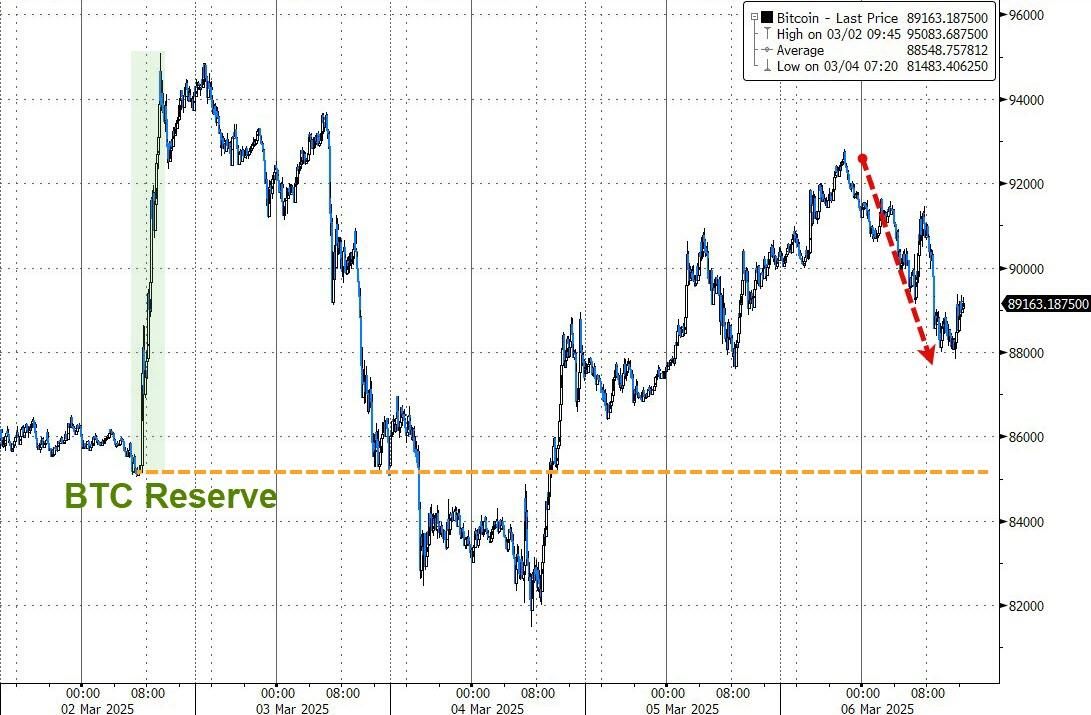
Bond yields edged higher, the dollar slipped, while Bitcoin surged from yesterday’s $76k level to $83k today. Gold also rallied, reclaiming the $2,900 mark.

The markets remain on edge, teetering between further breakdown and recovery. Much will depend on the latest tariff headlines from Washington.

Read More

Stocks Plummet As Recession Fears Mount Amid Tariff Concerns—TTI Goes Negative

Ulli Market Commentary Contact

[Chart courtesy of MarketWatch.com]

  1. Moving the market

Last week’s selling pressure continued this morning and intensified in the afternoon, dragging down the major indexes.

Traders were fixated on Trump’s comments about a possible economic slowdown and the potential for a recession following the implementation of US tariffs, indicating the economy is entering “a period of transition.”

The tech-heavy Nasdaq was hit the hardest, with the Mag7 basket experiencing its largest overall market cap decline ever. Notable losses included Tesla (-15%), Alphabet (-4%), Nvidia (-5%), and Meta (-4%), with Meta erasing its 2025 gains.

The recession scenario has been looming over the markets for some time, as tariffs can drive prices higher, increasing inflationary trends and causing the Fed to hesitate on much-anticipated rate cuts. These rate cuts are crucial drivers of any bull market.

Critical data points are on the agenda this week, highlighted by Wednesday’s CPI and Thursday’s PPI reports. While the major indexes managed a small bounce into the close, the damage was done, with all technical support levels broken. The Nasdaq led the decline, registering its biggest daily drop since September 2022.

As ZH pointed out, the Fed is unlikely to intervene, as the issue is not just a lack of growth but the reemergence of inflation, bringing “Stagflation” back to the forefront.

Bond yields tumbled, Bitcoin headed lower and appears to be in sync with global liquidity, which could lead to the next leg higher if history is any indication. The dollar edged higher, while gold dropped slightly below its $2,900 level.

Our main directional indicator, the TTI, also dipped below its long-term trend line, signaling a shift from bullish to bearish sentiment. For more details, please see section 3 below.

Read More

ETFs On The Cutline – Updated Through 03/07/2025

Ulli ETFs on the Cutline Contact

Do you want to know which ETFs are hot and which ones are not? Then you need my High-Volume ETF Cutline report. It tells you how close or far each of the 311 ETFs I follow is from its long-term trend line (39-week SMA). These are the ETFs that trade more than $5 million a day, so they are not some obscure funds that nobody cares about.

The report is split into two parts: The winners that are above their trend line (%M/A), and the losers that are below it. The yellow line is the line of shame that separates them. You can see how many ETFs are in each group and how they have changed since the last report (215 vs. 162 current).

Take a peek:

The HV ETF Master Cutline Report

If you are confused by some of the terms we use, don’t panic. I have a helpful Glossary of Terms for you.

If you want to learn more about the Cutline method and how it can make you rich (or at least less poor), read my original post here.

ETF Tracker Newsletter For March 7, 2025

Ulli ETF Tracker Contact

ETF Tracker StatSheet          

You can view the latest version here.

FED CHAIR POWELL’S COMMENTS SOOTHE MARKETS DESPITE ECONOMIC CONCERNS

[Chart courtesy of MarketWatch.com]

  1. Moving the market

Yesterday’s market weakness continued this morning, with major indexes heading south despite a green opening.

The S&P 500 experienced its worst week since September. The roller-coaster ride persisted as Trump’s tariff policies created uncertainty around job growth and inflation. However, he later confirmed that goods from Canada and Mexico, covered by the USMCA, would be exempt from import duties.

The much-anticipated jobs report was weaker than expected, with 151,000 jobs created in February versus the expected 170,000.

Although the S&P 500 dropped below its 200-day moving average again, comments from Fed Chair Powell at a New York event were interpreted as soothing, despite offering no new information:

“Despite elevated levels of uncertainty, the US economy continues to be in a good place.”

“We do not need to be in a hurry and are well positioned to wait for greater clarity.”

“The costs of being cautious are very, very low.”

“The economy’s fine. It doesn’t need us to do anything, really, and so we can wait, and we should wait.”

Traders took these comments positively, and dip buyers emerged, pulling the major indexes out of the doldrums and into a green close.

Looking at the big picture, the markets have not been kind to big tech, with Apple being the only $3 trillion company left. Nvidia and Tesla have tumbled $1 trillion and $700 billion, respectively, in market cap this year.

Macro data reinforced the weakness in economic growth, while inflation remains ever-present, solidifying the stagflation scenario. Yet, rate-cut expectations remain high.

Bond yields were higher for the week, while the dollar was the worst-performing asset. Bitcoin eked out modest gains, but gold dominated, having been higher for 9 of the last 10 weeks, although it has been range-trading for the past 4 days.

Crude oil retreated for the 7th week in a row, breaking below the $70 level to reach its lowest price since May 2023.

Does this mean we should expect more relief in the form of tumbling gas prices?

Read More

Weekly StatSheet For The ETF Tracker Newsletter – Updated Through 03/06/2025

Ulli ETF StatSheet Contact

ETF Data updated through Thursday, March 6, 2025

How to use this StatSheet:

  1. Out of the 1,800+ ETFs out there, I only pick the ones that trade over $5 million per day (HV ETFs), so you don’t get stuck with a lemon that nobody wants to buy or sell.
  1. Trend Tracking Indexes (TTIs)

These are the main indicators that tell you when to buy or sell Domestic and International ETFs (section 1 and 2). They do that by comparing their position to their long-term M/A (Moving Average). If they cross above, and stay there, it’s a green light to buy. If they fall below, and keep going, it’s a red light to sell. And to make sure you don’t lose your shirt if things go south, I also use a 12% trailing stop loss on all positions in these categories.

  1. All other investment areas don’t have a TTI and should be traded based on the position of each ETF relative to its own trend line (%M/A). That’s why I call them “Selective Buy.” In other words, if an ETF goes above its own trend line, you can buy it. But don’t forget to use a trailing sell stop of 12%, or less if you’re feeling nervous.

If some of these words sound like Greek to you, please check out the Glossary of Terms and new subscriber information in section 9.

  1. DOMESTIC EQUITY ETFs: BUY— since 11/21/2023

Click on chart to enlarge

This is our main compass, the Domestic Trend Tracking Index (TTI-green line in the above chart). It has broken above its long-term trend line (red) by +0.07% and is in “Buy” mode as posted.

Read More

Tech Sell-Off Continues Amid Policy Uncertainty And Growth Concerns

Ulli Market Commentary Contact

[Chart courtesy of MarketWatch.com]

  1. Moving the market

After a solid green close on Wednesday, the markets reversed course early on Thursday as traders sought more clarity on the latest tariff measures and their economic impact.

Despite Commerce Secretary Lutnick’ s announcement of likely one-month exemptions for “more than just carmakers,” markets remained mired in uncertainty throughout the morning and turned downward in the afternoon.

The markets faced a trifecta of trouble, as ZH described it:

1. Tariffs and broader policy uncertainty

2. The sustainability of the AI trade following DeepSeek

3. Upward pressure on sovereign rates, such as those in Germany

Traders’ aversion to uncertainty led to a downward trend, with mega-cap tech stocks selling off again and the Mag7 basket continuing to decline. Growth concerns, highlighted in various surveys, suggest that the threat of stagflation remains ever-present.

Adding to traders’ concerns, both the Nasdaq and S&P 500 broke their 200-day moving averages (DMAs) on an intra-day basis, which can signal a trend change from bullish to bearish, though prices bounced off that level.

Bond yields were mixed, with rate-cut expectations holding at three for this year. The dollar tumbled again, while gold traded steadily in a tight range above the $2,900 level. Bitcoin lost its $90k support ahead of tomorrow’s White House crypto summit.

Friday’s highlights will include the eagerly anticipated non-farm payrolls report, which has been dubbed the “most important data point ever.” Depending on the outcome, we might see some fireworks in the markets.

Read More