ETFs/Mutual Funds On The Cutline – Updated Through 05/13/2016

Ulli ETFs on the Cutline Contact

Below are the latest ETF Cutline reports, which show how far above or below their respective long-term trend lines (39 week SMA) my currently tracked ETFs/MFs are positioned.

The first report covers the ETF Master List from Thursday’s StatSheet and includes 381 ETFs, of which currently 242 (last week 263) are hovering in bullish territory.

The second report includes only High Volume ETFs. To clarify, High Volume (HV) ETFs are defined as those with an average daily volume of $10 million or higher. Volume figures can change in a hurry, so be sure to check first before investing.

These ETFs are generated from my selected list of 98 that I use in my advisor practice. It cuts out the “noise,” which simply means it eliminates those ETFs that I would never buy because of their volume limitations. 55 ETFs (last week 62) have managed to remain in bullish territory after the recent market volatility.

The third report covers Mutual Funds on the Cutline. There are currently 261 (last week 290) above the line and 519 below it out of the 780 that I follow.

Take a look:

  1. ETF Master Cutline Report
  2. ETF High Volume Cutline Report
  3. MF Cutline Report

In case you are not familiar with some of the terminology used in the reports, please read the Glossary of Terms.

If you missed the original post about the Cutline approach, you can read it here.

One Man’s Opinion: “We Are Unsure Whether To Wear A Helmet Or A Diaper” – Merger Arb Funds Crushed

Ulli Market Review Contact

By ZeroHedge

Man

2015 was the year of M&A (Mergers & Acquisitions): some $5 trillion in global merger and acqusition deals were announced, the highest level ever, topping even pre-crash 2007. In fact, last year there were more mega-deals, those valued at $20 billion or above, than ever. In all, there were 17 deals at or above that value compared with 35 such deals in the five years from 2010 through 2014. Such was the cheap debt-fuelled boom in large deals that the average size of all M&A valued at $500 million or above was $3.3 billion, up from $2.2 billion in 2014.

However, as Bloomberg observes, this year M&A is hitting a more dubious record: deals gone bust as some 10%, or $504 billion, of all deals announced last year have been terminated following a furious crackdown by the US Treasury on tax inversions which killed what would have been the biggest M&A deal ever, Pfizer’s acquisition of Allergan, as well as numerous other deals found to have been anti-competitive by the FTC.

Wednesday was especially bad for bankers as two mergers valued at a combined $21 billion collapsed. The latest cancelled deals mean 2015 has been stripped of its title as the biggest year for deal-making, dropping to $4.06 trillion compared with 2007’s $4.09 trillion.

Read More

New ETFs On The Block: SPDR Doubleline Emerging Markets Fixed Income ETF (EMTL)

Ulli Fixed Income ETFs Contact

91551519State Street Global Advisors (SSgA), the Boston-based third largest US issuer of exchange-traded funds, and DoubleLine Capital – promoted by star fixed-income manager Jeffrey Gundlach, recently rolled out a pair of new ETFs; one aimed at fixed income securities from emerging markets and another at short-maturity bonds.

The actively managed SPDR DoubleLine Emerging Markets Fixed Income ETF (EMTL) seeks to provide exposure to emerging market fixed-income instruments, both corporate and sovereign issuers, and aims to beat the performance of the JP Morgan Corporate Emerging Market Bond Index (broadly diversified).

ETML has tapped a largely virgin niche since there were only four actively managed bond funds prior to its launch. DoubleLine’s expertise in sovereign screening, duration positioning and risk management, combined with their bottom-up research that includes sovereign macro overlays, does make for a compelling investment case for the new fund.

Read More

ETF/No Load Fund Tracker Newsletter For May 13, 2016

Ulli ETF Tracker Contact

ETF/No Load Fund Tracker StatSheet

————————————————————-

https://theetfbully.com/2016/05/weekly-statsheet-for-the-etfno-load-fund-tracker-newsletter-updated-through-05122016/

————————————————————

Market Commentary

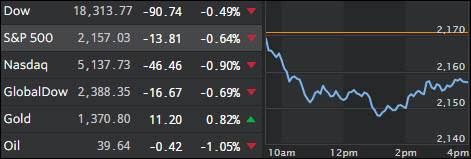
MARKETS END WEEK ON A DULL NOTE

Fri pic

[Chart courtesy of MarketWatch.com]

1. Moving the Markets

Although all 3 major indexes ended in the red, we heard some positive news that retail sales rebounded in April and jumped 1.3% after dropping 0.3% in March. It is the largest rise in 13 months and the increase was partly due to higher gasoline prices and auto sales. Retail sales, excluding gas and autos, rose 0.6%. Names like Nordstrom (JWN) and J.C. Penny (JCP) reported poor earnings figures today, however, the big beat on overall retail sales figures for April suggests that there has been allegedly resurgence in consumption, following a weak first quarter.

Major U.S. stock indexes have also been hit by a continued fall in shares of tech giant Apple (AAPL). The stock remains under pressure following its sub-par Q1 earnings report in late April that showed the first-ever quarterly decline in iPhone sales due to a maturing smart phone space. Apple was briefly supplanted Thursday as the world’s most valuable company measured by market value by Google (GOOGL) parent Alphabet. Apple shares are down 14.2% in 2016 and have fallen 2.6% so far this week heading into Friday’s trading.

The price of U.S.-produced crude was also in retreat, falling 55 cents, or 1.1%, to $46.19 a barrel. The $46.19 mark still maintains a continued long-term upward movement.

Read More

Weekly StatSheet For The ETF/No Load Fund Tracker Newsletter – Updated Through 05/12/2016

Ulli ETF StatSheet Contact

ETF/Mutual Fund Data updated through Thursday, May 12, 2016

TOC042816

If you are not familiar with some of the terminology used, please see the Glossary of Terms.


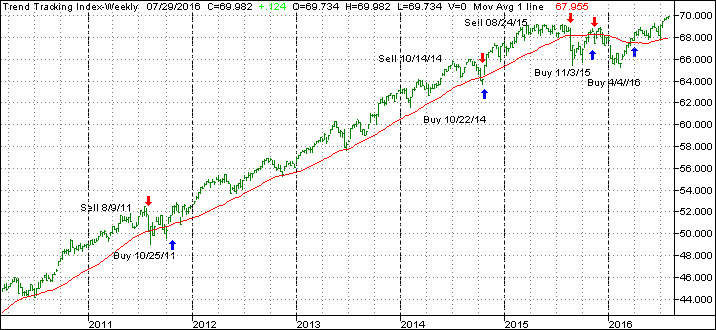
1. DOMESTIC EQUITY MUTUAL FUNDS/ETFs: BUY — since 4/4/2016

TTI

Our main directional indicator, the Domestic Trend Tracking Index (TTI-green line in above chart) has recently crossed above its long term trend line (red) by +1.26% generating a new Domestic Buy signal effective 4/4/2016 as posted on the blog.

Read More

Treading Water

Ulli Market Commentary Contact

Thur pic

[Chart courtesy of MarketWatch.com]

1. Moving the Markets

It was a mixed day as the the above intra-day chart of the S&P 500 shows. Dancing above and below its unchanged line and ending 0.02% lower isn’t exactly a sign of a strong bull market.

The Nasdaq fared the worst as Apple got clobbered again tumbling to a two-year low producing a heavy drag on the major indexes. Worries about slowing demand for iPhones were seen as the culprit.

There seems to be a lack of conviction in the market by both, buyers and sellers as the economy grinds along without making any headway. Retailers have been suffering with the latest casualty being Nordstrom with their disaster earnings announcement after hours. As I am writing this, the stock is getting clobbered at the tune of -17%. Ouch…

Read More