Nervousness Prevails Before Debate; Deutsche Bank Clobbers US Financials

Ulli Market Commentary Contact

mon-pic

[Chart courtesy of MarketWatch.com]

1. Moving the Markets

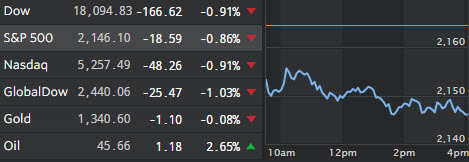
While a general unease about tonight’s debate kept the major indexes in negative territory all day, other bad news contributed to the weakness as well. New home sales tumbled with prices touching lows not see in some 2 years while the supply of homes rose to 4.6 months from 4.2 months when using the current rate of sales.

Then there was Deutsche Bank. I have repeatedly posted that either Deutsche Bank or the Italian banking system may be the “canary in the coalmine” contributing to a “re-set” in asset prices should either one implode. At least for the day, it was Deutsche’s turn to put lipstick on that pig by “managing news flow” in the most positive way possible.

Nevertheless, its stock price made an all-time low, not just down over 7% on the day but also down 16% since the middle of September, and in great jeopardy of going into single digits.

Why is that such a big deal? Mainly because Deutsche has the largest derivatives book in the world with over $50 trillion; if they run into financial difficulties every banking system in the world will be affected.  Looking at a stock price comparison between Deutsche and Lehman Bothers, who ushered in the last financial crisis, you will find the similarities amazing:

Read More

One Man’s Opinion: Traveling Circus

Ulli Market Review Contact

OneMan'sOpinionSubmitted by Paul Brodksy

After Wednesday’s policy statements by the Fed and Bank of Japan, a harsh light is being shined on the incredible nature of their communications. It would be wise in the current environment to structure investment portfolios with a pro-volatility bias.

Central banks in G7 economies have been carrying a heavy load for a very long time, especially noticeable to all since 2009. Zero and negative sovereign interest rates, asset purchase programs and whack-a-mole currency devaluations have avoided a counterfactual that would have included credit exhaustion, debt deflation and economic contraction.

Read More

ETFs On The Cutline – Updated Through 09/23/2016

Ulli ETFs on the Cutline Contact

Below please find the latest High Volume ETF Cutline report, which shows how far above or below their respective long-term trend lines (39 week SMA) my currently tracked ETFs are positioned.

This report covers the HV ETF Master List from Thursday’s StatSheet and includes 366 High Volume ETFs ETFs, defined as those with an average daily volume of more than $5 million, of which currently 323 (last week 306) are hovering in bullish territory. The yellow line separates those ETFs that are positioned above their trend line from those that have dropped below it.

Take a look:

The HV ETF Master Cutline Report  

In case you are not familiar with some of the terminology used in the reports, please read the Glossary of Terms.

If you missed the original post about the Cutline approach, you can read it here.

ETF Tracker Newsletter For September 23, 2016

Ulli ETF Tracker Contact

ETF Tracker StatSheet

————————————————————-

https://theetfbully.com/2016/09/weekly-statsheet-for-the-etf-tracker-newsletter-updated-through-09222016/

————————————————————

Market Commentary

DULL FRIDAY, POSITIVE WEEK

fri-pic

[Chart courtesy of MarketWatch.com]

1. Moving the Markets

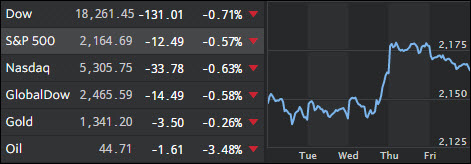
Stocks ended lower today after three straight days of gains as momentum from the Fed’s decision Wednesday to chicken out on any interest rate hike this month slowed. Despite Friday’s drop, all three major indexes posted gains for the week.

Rumor in the tech world has it that social-media giant Twitter could perhaps receive an acquisition bid, possibly from Salesforce (CRM) or Google (GOOGL). Twitter (TWTR) shares soared almost 20% for the day closing at $22.62 a share. While the daily gain may seem notable, the stock is just $0.10 above the beginning of the year price of $22.56 a share.

Oil prices were a bit volatile today, getting hammered in early trading before paring those losses on hopes of a deal between Iran and Saudi Arabia. Although Saudi Arabia reportedly offered to slash production if Iran freezes their production, few oil industry observers expect a lasting agreement and prices fell sharply once again with oil losing 3.48% on the day.

Moving forward, not just news surrounding the Fed’s decision regarding interest rates will likely create short-term volatility but also continued weaker economic reports the latest of which pointed to the lowest GDP growth since the financial crisis as a slowdown in manufacturing activity confirmed. In the end, you just have to wonder how long this manipulated market can remain disconnected from the underlying GDP reality. Take a look at this updated chart:

Read More

Weekly StatSheet For The ETF Tracker Newsletter – Updated Through 09/22/2016

Ulli ETF StatSheet Contact

ETF Data updated through Thursday, September 22, 2016

TOC082516

Methodology/Use of this StatSheet:

  1. From the universe of over 1,800 ETFs, I have selected only those with a trading volume of over $5 million per day (HV ETFs), so that liquidity and a small bid/ask spread are assured.
  2. Trend Tracking Indexes (TTIs)

Buy or Sell decisions for Domestic and International ETFs (section 1 and 2), are made based on the respective TTI and its position either above or below its long-term M/A (Moving Average). A crossing of the trend line from below accompanied by some staying power above constitutes a “Buy” signal. Conversely, a clear break below the line constitutes a “Sell” signal. Additionally, I use a 7.5% trailing stop loss on all positions in these categories to control downside risk.

  1. All other investment arenas do not have a TTI and should be traded based on the position of the individual ETF relative to its own respective trend line (%M/A). That’s why those signals are referred to as a “Selective Buy.” In other words, if an ETF crosses its own trendline to the upside, a “Buy” signal is generated. Since these areas tend to be more volatile, I recommend a wider trailing sell stop of 7.5% -10% depending on your risk tolerance.

If you are unfamiliar with some of the terminology, please see Glossary of Terms and new subscriber information in section 9.


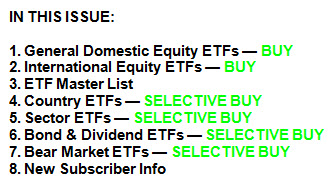
1. DOMESTIC EQUITY ETFs: BUY — since 4/4/2016

tti

Our main directional indicator, the Domestic Trend Tracking Index (TTI-green line in the above chart) remains above its long-term trend line (red) by +2.84% after having generated a new Domestic Buy signal effective 4/4/2016 as posted.

Read More

The Fed’s In Charge: Equities, Bonds And Precious Metals Gain

Ulli Market Commentary Contact

thur-pic

[Chart courtesy of MarketWatch.com]

1. Moving the Markets

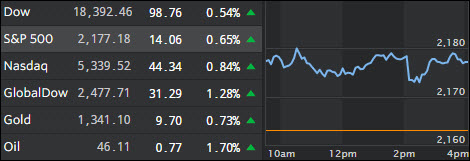
Thanks to the Fed’s decision of not raising rates and thereby keeping the financial markets happy, the computer algos went wild for a second day in a row with the major indexes, along with gold and silver, benefitting by closing higher although on abysmal volume. Never mind that US growth was forecasted to records lows, all that matters was that the stock market got pushed higher no matter what the constantly deteriorating economic data points are saying.

The Bloomberg’s Consumer Comfort Index plunged to the lowest since the end of last year as existing home sales, after last month’s unexpected dramatic drop of 3.4%, showed an annual decline of 1.64%.

Analyzing the current state of affairs accurately and succinctly was CNBC’s Dennis Gartman with this remark:

Read More