ETFs On The Cutline – Updated Through 12/01/2023

Ulli ETFs on the Cutline Contact

Do you want to know which ETFs are hot and which ones are not? Then you need my High-Volume ETF Cutline report. It tells you how close or far each of the 311 ETFs I follow is from its long-term trend line (39-week SMA). These are the ETFs that trade more than $5 million a day, so they are not some obscure funds that nobody cares about.

The report is split into two parts: The winners that are above their trend line (%M/A), and the losers that are below it. The yellow line is the line of shame that separates them. You can see how many ETFs are in each group and how they have changed since the last report (179 vs. 245 current).

Take a peek:

The HV ETF Master Cutline Report

If you are confused by some of the terms we use, don’t panic. I have a helpful Glossary of Terms for you.

If you want to learn more about the Cutline method and how it can make you rich (or at least less poor), read my original post here.

ETF Tracker Newsletter For December 1, 2023

Ulli ETF Tracker Contact

ETF Tracker StatSheet          

You can view the latest version here.

STOCKS SOAR, BONDS AND GOLD RALLY, BUT EXPERTS WARN OF TROUBLE AHEAD

[Chart courtesy of MarketWatch.com]

  1. Moving the markets 

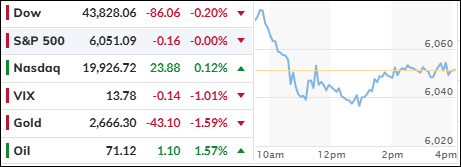
The markets soared on Friday, ending the best month of the year with a bang. The Dow Jones Industrial Average hit a new 2023 record, while the S&P and Nasdaq followed suit. But not everyone is celebrating the rally. Some experts are warning that the party may soon be over, as the economy shows signs of slowing down and the Fed signals rate cuts in sight.

One of the skeptics was Fed Chair Jerome Powell, who poured cold water on the market’s hopes for lower interest rates. He said it was too early to say if the Fed’s policy was too tight, and that the central bank would not act based on “speculation”. His remarks sent bond yields tumbling, as investors priced in a higher chance of a rate cut as soon as March. The market now thinks there is an 80% probability of a cut, up from 40% yesterday.

Gold also surged, hitting a new all-time high of around $2,090 an ounce. The precious metal has been on a tear since October, thanks to strong demand from central banks and investors. Gold is seen as a “safe haven” in times of uncertainty, and a hedge against inflation. Some traders think the current environment is perfect for gold, as the economy is cooling but not collapsing, and the Fed is on hold but not hiking. They call it the Goldilocks scenario: not too hot, not too cold.

But not all the market moves made sense. Bloomberg noted that bonds had a better reason to rally than stocks, which had to factor in the growth concerns that underpin Powell’s remarks. The latest data showed that the manufacturing sector contracted for the fourth month in a row in November, and that the economy was showing typical early signs of recession, according to Bloomberg Economics.

ZeroHedge pointed out that, historically, stocks tend to drop sharply right before the Fed cuts rates, as the market realizes why the Fed is panicking. The last time the Fed cut rates, in March 2020, stocks plunged by 30% in a matter of weeks, as the coronavirus pandemic triggered a global lockdown.

Will history repeat itself?

Read More

Weekly StatSheet For The ETF Tracker Newsletter – Updated Through 11/30/2023

Ulli ETF StatSheet Contact

ETF Data updated through Thursday, November 30, 2023

How to use this StatSheet:

  1. Out of the 1,800+ ETFs out there, I only pick the ones that trade over $5 million per day (HV ETFs), so you don’t get stuck with a lemon that nobody wants to buy or sell.
  1. Trend Tracking Indexes (TTIs)

These are the main indicators that tell you when to buy or sell Domestic and International ETFs (section 1 and 2). They do that by comparing their position to their long-term M/A (Moving Average). If they cross above, and stay there, it’s a green light to buy. If they fall below, and keep going, it’s a red light to sell. And to make sure you don’t lose your shirt if things go south, I also use a 12% trailing stop loss on all positions in these categories.

  1. All other investment areas don’t have a TTI and should be traded based on the position of each ETF relative to its own trend line (%M/A). That’s why I call them “Selective Buy.” In other words, if an ETF goes above its own trend line, you can buy it. But don’t forget to use a trailing sell stop of 12%, or less if you’re feeling nervous.

If some of these words sound like Greek to you, please check out the Glossary of Terms and new subscriber information in section 9.

  1. DOMESTIC EQUITY ETFs: BUY— since 11/21/2023

Click on chart to enlarge

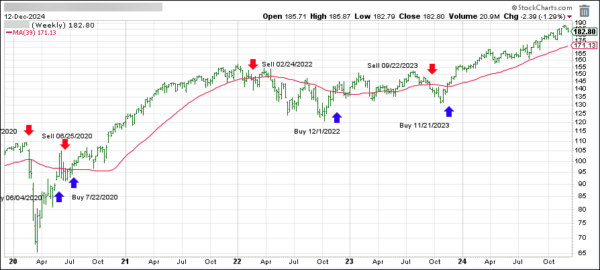
This is our main compass, the Domestic Trend Tracking Index (TTI-green line in the above chart). It has now broken above its long-term trend line (red) by +2.87% and has generated a new “Buy” as posted.

Read More

Market Celebrates Thanksgiving With A Feast Of Gains, But Will It Face A Reality Check Soon?

Ulli Market Commentary Contact

[Chart courtesy of MarketWatch.com]

  1. Moving the markets 

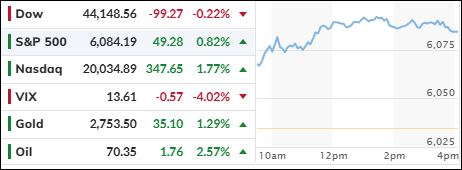
The stock market celebrated Thanksgiving with a feast of gains, as the Dow Jones Industrial Average hit a new high for 2023 on Thursday. The index was boosted by inflation data that raised hopes of a Fed rate cut next year.

The S&P 500 also managed to end the day in positive territory, while the Nasdaq lagged. Both indexes were still within striking distance of their 2023 peaks.

The S&P 500 had a stellar November, rising 8.9%. However, this was partly a rebound from a dismal September and October when it lost 7.1%. So, over a three-month period, the gain was less impressive.

The inflation data that cheered the market was the personal consumption expenditures price index (PCE), which is the Fed’s preferred measure of price changes. The PCE rose 0.2% in October, matching expectations, and 3.5% year-over-year. This suggested that inflation was cooling down, but not too much to hurt growth. Traders hoped that this would give the Fed enough reason to keep rates steady, before lowering them in 2024.

The bond market also had a great month, as yields dropped in November. US bonds had their best month since May 1985 and turned positive for the year. As one analyst remarked, “suddenly 5% yields on the 10-year have become a distant memory.”

The rally in bonds and stocks made financial conditions much easier, in fact, October saw the biggest absolute monthly loosening of financial conditions in history (back to 1982).

The dollar had a rough month, falling 3% in November. This was its biggest monthly decline since November 2022. Gold shone for the second month in a row and was close to breaking its record high. Oil prices slipped for the second consecutive month.

As ZeroHedge pointed out, November was truly a month of “bad news” being “good news” for stocks, as “hard data” hit a 14-month low, while stocks surged back near record highs.

Traders are elated that inflation has been coming down, and at the same time it hasn’t been unduly affecting growth. But be careful what you wish for. After all, if financial conditions loosen much more, the Fed will be forced to jawbone some reality back into the market, as November saw the biggest increase in rate-cut expectations for 2024 since Nov 2022.

Will the markets be able to handle any dose of reality?

Read More

Market Swings Between Hope And Fear As Fed Sends Mixed Signals

Ulli Market Commentary Contact

[Chart courtesy of MarketWatch.com]

  1. Moving the markets 

The stock market had a wild ride today, as investors were torn between hope and fear. On one hand, they hoped that the Fed was done hiking rates, and that the economy would be growing faster than expected. On the other hand, they feared that inflation was still a threat and that the Fed might change its mind and raise rates again.

The hope came from the latest GDP data, which showed that the economy grew at a 5.2% annual rate in the third quarter, thanks to more government spending and business investment. It also came from the comments of Fed Governor Waller, who said that the current policy was tight enough to bring inflation down to the Fed’s 2% target.

The fear came from the remarks of Richmond Fed President Barkin, who said that the Fed could still hike rates if inflation did not cool down. It also came from the uncertainty about the Fed’s plans. Will they start to signal rate cuts for next year, as the market expects? Or will the Fed surprise the market with a hawkish stance, as inflation might rebound and prove to be more than transitory?

The market did not know how to react to these mixed signals. The major indexes swung back and forth, ending the day with modest losses. The bond market, however, had a clear reaction. Bond yields fell sharply, as investors priced in more rate cuts for next year. The 10-year and 30-year yields dropped by 65 basis points this month, the biggest monthly decline since 2008.

The lower yields boosted the stock market, especially the meme stocks that are popular among retail investors. Goldman Sachs’ index of retail favorites hit a new high this month. The dollar also bounced back, while gold continued to soar towards new records. Oil prices were volatile, as traders awaited the outcome of the OPEC+ meeting on production quotas.

This market summary ends with a question that captures the main dilemma facing investors:

Will the Fed cut or hike rates next year? This question invites you to think about the implications of the Fed’s actions for the economy and the markets.

Read More

Fed Official Boosts Market With Dovish Comments, Gold Nears Record High

Ulli Market Commentary Contact

[Chart courtesy of MarketWatch.com]

  1. Moving the markets 

The stock market edged up slightly today, continuing its November comeback, after a Fed official hinted that interest rates may not go up any further. Christopher Waller, a Fed governor, said he was confident that the current policy was enough to cool down the economy and bring inflation back to the 2% target. He spoke ahead of the next Fed meeting on December 12-13.

The slight gain today came after a strong month of trading, which will end on Thursday. The S&P 500 is set to end the month with an 8.4% increase, more than making up for the 7.1% drop in September and October. But this also shows that the November rally was not as impressive as it seemed.

The market is now in a wait-and-see mode, as investors look for clues from holiday spending trends. The bulls and the bears are still in a stalemate. And that means that the market may be more choppy than smooth.

The economic data today was not very encouraging, as it showed signs of a slowing economy. Home prices, consumer confidence, and manufacturing all came in below expectations. The economic surprise index took a hit, as the effects of the government stimulus faded.

The Fed governor also warned that the recent easing of financial conditions may not last, and that policymakers should not rely on them to do their job. He said that many factors can affect financial conditions, and that they should be careful.

The market moved sideways for most of the day but managed to squeeze out some small gains thanks to a short squeeze. Bond yields and the dollar both fell, helping the stock market. The 10-year yield dropped to a nearly 4-month low, and the dollar hit another low.

Gold benefited from the weak dollar, and rose to $2,042, close to its record high. Will it break that level this quarter?

Read More