- Moving the markets
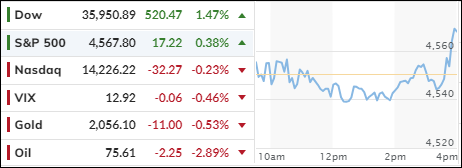
The stock market celebrated Thanksgiving with a feast of gains, as the Dow Jones Industrial Average hit a new high for 2023 on Thursday. The index was boosted by inflation data that raised hopes of a Fed rate cut next year.
The S&P 500 also managed to end the day in positive territory, while the Nasdaq lagged. Both indexes were still within striking distance of their 2023 peaks.
The S&P 500 had a stellar November, rising 8.9%. However, this was partly a rebound from a dismal September and October when it lost 7.1%. So, over a three-month period, the gain was less impressive.
The inflation data that cheered the market was the personal consumption expenditures price index (PCE), which is the Fed’s preferred measure of price changes. The PCE rose 0.2% in October, matching expectations, and 3.5% year-over-year. This suggested that inflation was cooling down, but not too much to hurt growth. Traders hoped that this would give the Fed enough reason to keep rates steady, before lowering them in 2024.
The bond market also had a great month, as yields dropped in November. US bonds had their best month since May 1985 and turned positive for the year. As one analyst remarked, “suddenly 5% yields on the 10-year have become a distant memory.”
The rally in bonds and stocks made financial conditions much easier, in fact, October saw the biggest absolute monthly loosening of financial conditions in history (back to 1982).
The dollar had a rough month, falling 3% in November. This was its biggest monthly decline since November 2022. Gold shone for the second month in a row and was close to breaking its record high. Oil prices slipped for the second consecutive month.
As ZeroHedge pointed out, November was truly a month of “bad news” being “good news” for stocks, as “hard data” hit a 14-month low, while stocks surged back near record highs.
Traders are elated that inflation has been coming down, and at the same time it hasn’t been unduly affecting growth. But be careful what you wish for. After all, if financial conditions loosen much more, the Fed will be forced to jawbone some reality back into the market, as November saw the biggest increase in rate-cut expectations for 2024 since Nov 2022.
Will the markets be able to handle any dose of reality?
2. Current “Buy” Cycles (effective 11/21/2023)
Our Trend Tracking Indexes (TTIs) have both crossed their trend lines with enough strength to trigger new “Buy” signals. That means, Tuesday, 11/21/2023, was the official date for these signals.
If you want to follow our strategy, you should first decide how much you want to invest based on your risk tolerance (percentage of allocation). Then, you should check my Thursday StatSheet and Saturday’s “ETFs on the Cutline” report for suitable ETFs to buy.
3. Trend Tracking Indexes (TTIs)
The major indexes had a mixed performance, with the Dow leading the gains, the S&P 500 barely closing higher, and Nasdaq finishing lower.
Our TTIs indicated more bullish sentiment by moving further away from their trend lines.
This is how we closed 11/30/2023:
Domestic TTI: +2.87% above its M/A (prior close +2.02%)—Buy signal effective 11/21/2023.
International TTI: +3.78% above its M/A (prior close +3.54%)—Buy signal effective 11/21/2023.
All linked charts above are courtesy of Bloomberg via ZeroHedge.
Contact Ulli