
- Moving the markets
The stock market had a wild ride today, as investors were torn between hope and fear. On one hand, they hoped that the Fed was done hiking rates, and that the economy would be growing faster than expected. On the other hand, they feared that inflation was still a threat and that the Fed might change its mind and raise rates again.
The hope came from the latest GDP data, which showed that the economy grew at a 5.2% annual rate in the third quarter, thanks to more government spending and business investment. It also came from the comments of Fed Governor Waller, who said that the current policy was tight enough to bring inflation down to the Fed’s 2% target.
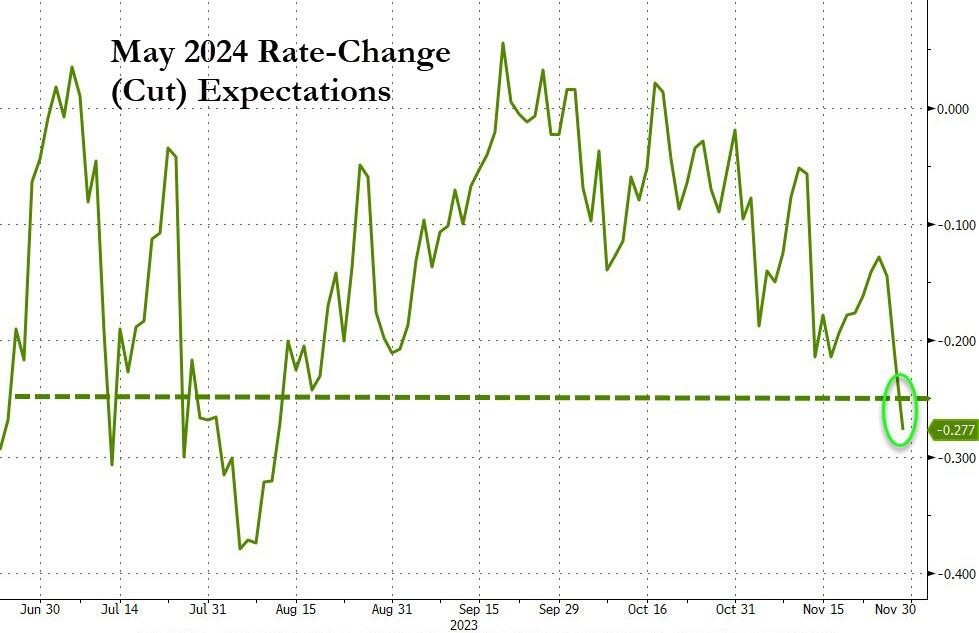
The fear came from the remarks of Richmond Fed President Barkin, who said that the Fed could still hike rates if inflation did not cool down. It also came from the uncertainty about the Fed’s plans. Will they start to signal rate cuts for next year, as the market expects? Or will the Fed surprise the market with a hawkish stance, as inflation might rebound and prove to be more than transitory?
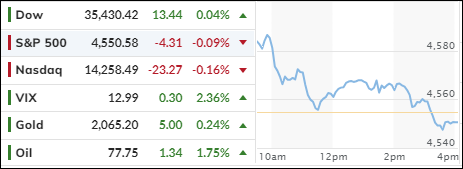
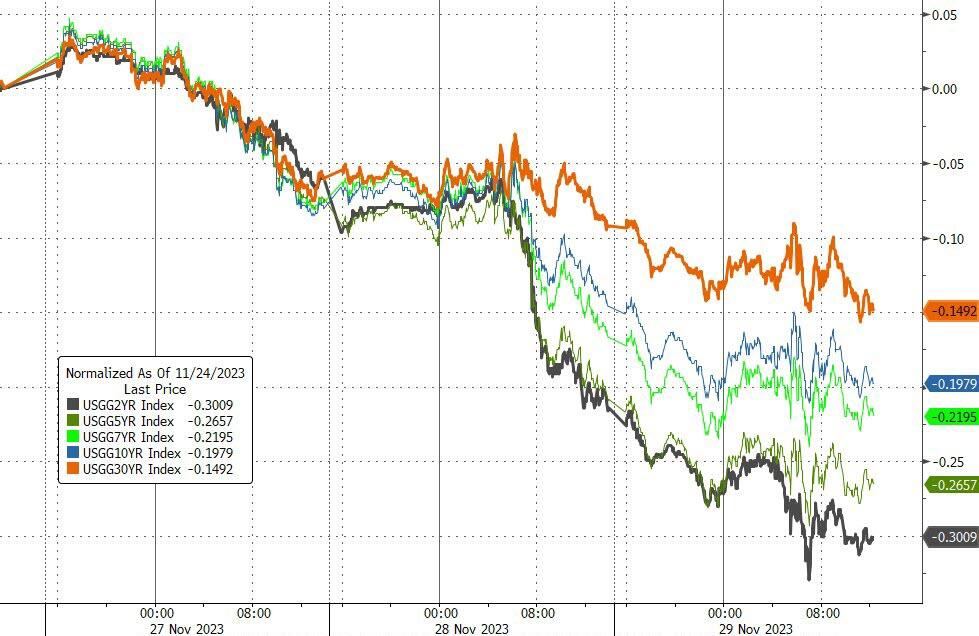
The market did not know how to react to these mixed signals. The major indexes swung back and forth, ending the day with modest losses. The bond market, however, had a clear reaction. Bond yields fell sharply, as investors priced in more rate cuts for next year. The 10-year and 30-year yields dropped by 65 basis points this month, the biggest monthly decline since 2008.
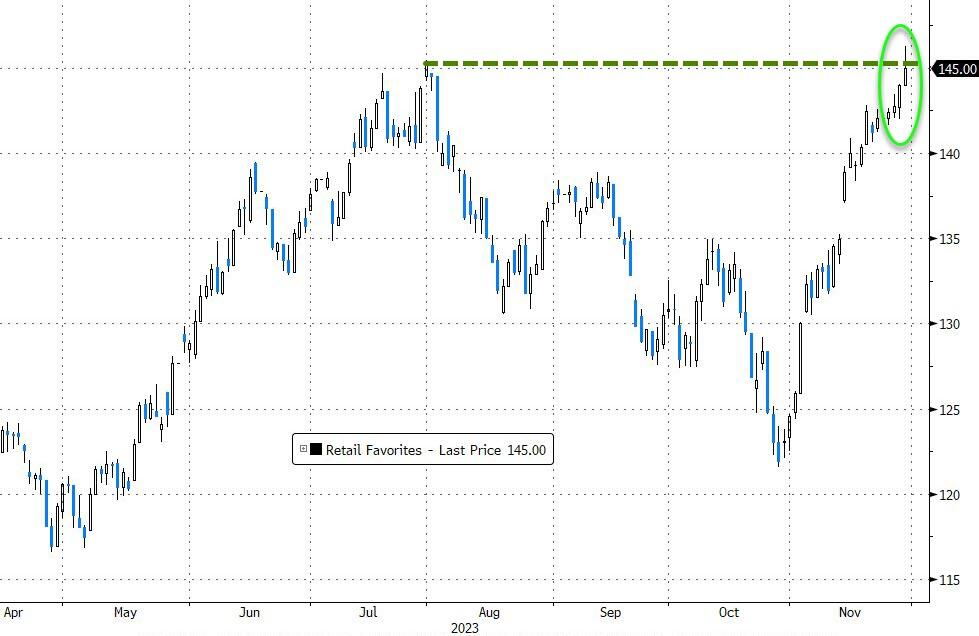
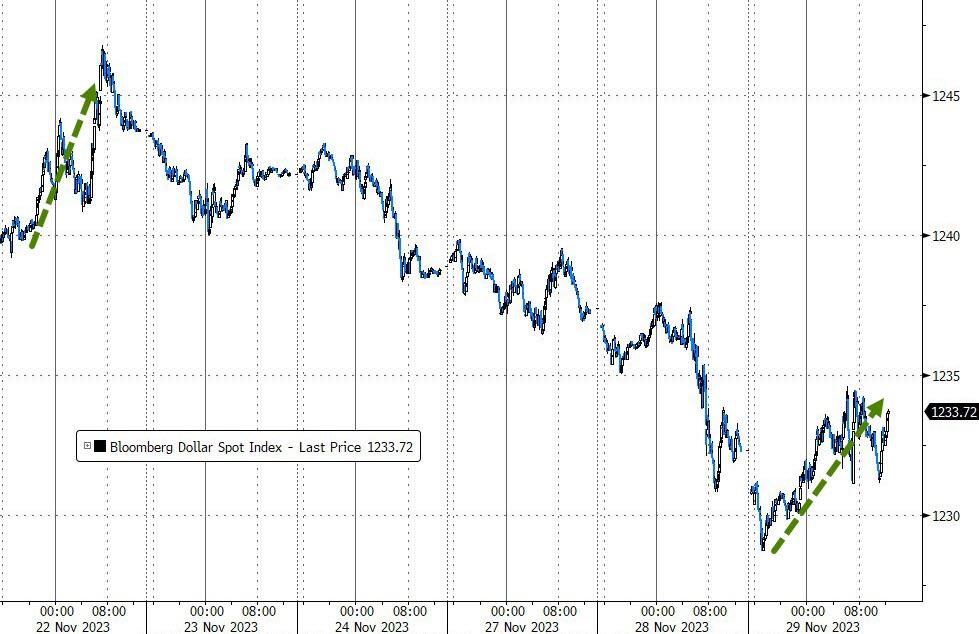
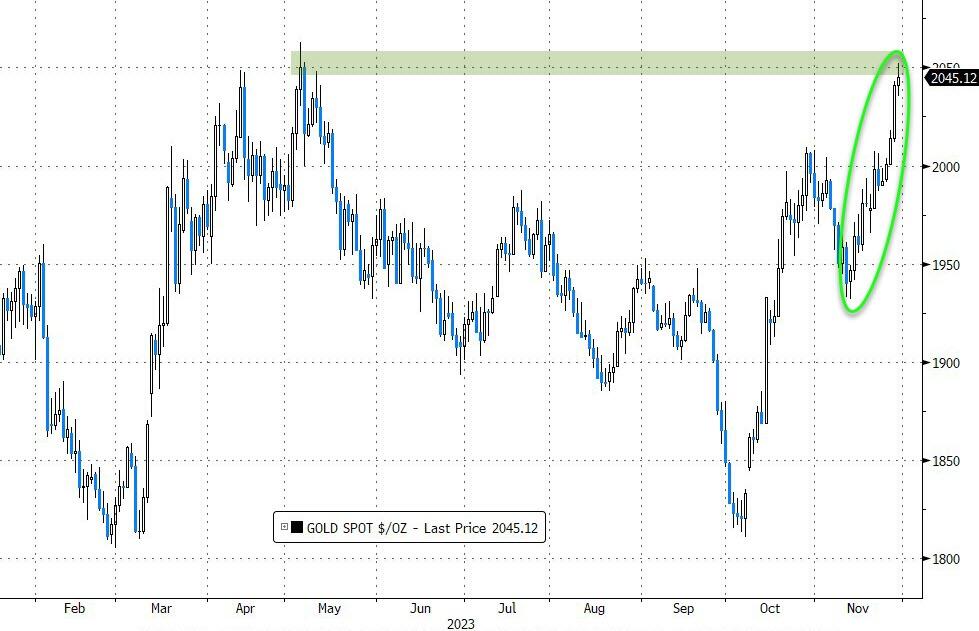
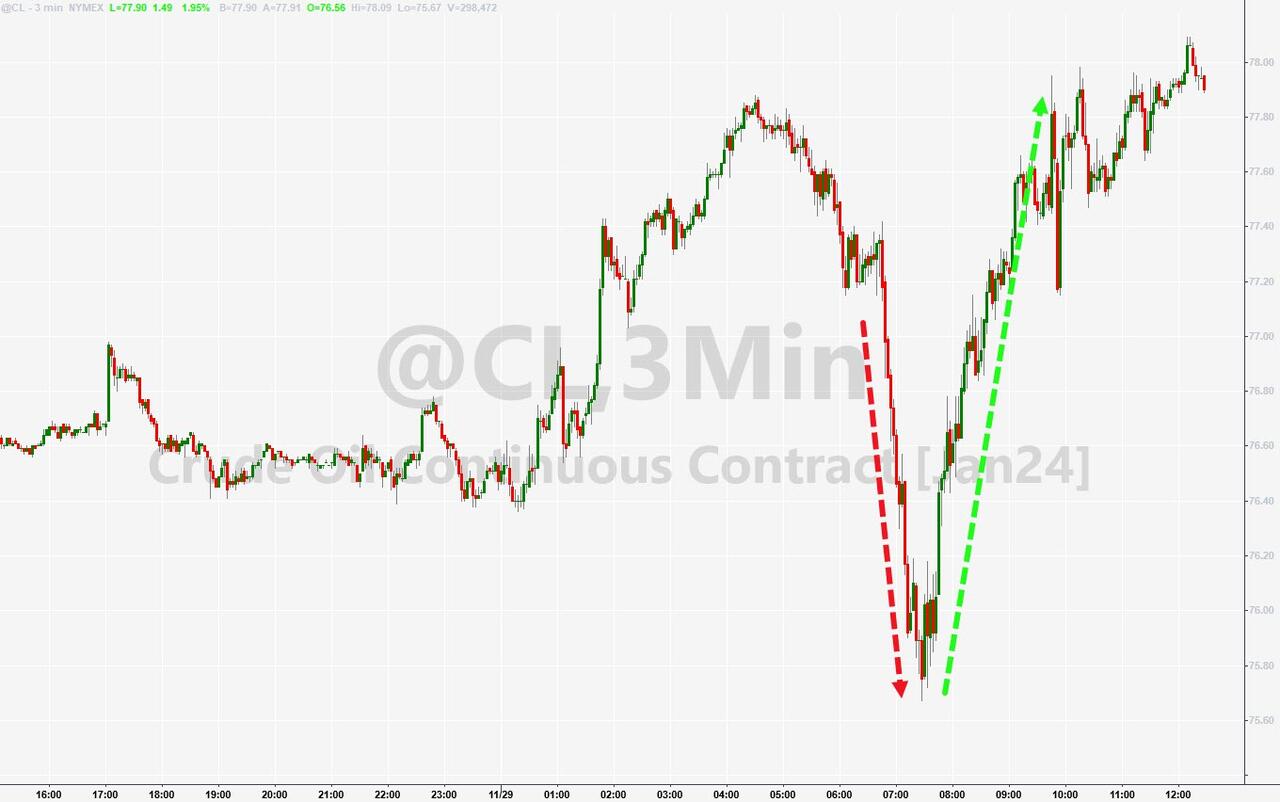
The lower yields boosted the stock market, especially the meme stocks that are popular among retail investors. Goldman Sachs’ index of retail favorites hit a new high this month. The dollar also bounced back, while gold continued to soar towards new records. Oil prices were volatile, as traders awaited the outcome of the OPEC+ meeting on production quotas.
This market summary ends with a question that captures the main dilemma facing investors:
Will the Fed cut or hike rates next year? This question invites you to think about the implications of the Fed’s actions for the economy and the markets.
2. Current “Buy” Cycles (effective 11/21/2023)
Our Trend Tracking Indexes (TTIs) have both crossed their trend lines with enough strength to trigger new “Buy” signals. That means, Tuesday, 11/21/2023, was the official date for these signals.
If you want to follow our strategy, you should first decide how much you want to invest based on your risk tolerance (percentage of allocation). Then, you should check my Thursday StatSheet and Saturday’s “ETFs on the Cutline” report for suitable ETFs to buy.
3. Trend Tracking Indexes (TTIs)
The major indexes showed little change as they fluctuated between gains and losses. The International TTI stayed at the same level, while the Domestic TTI increased its bullish momentum.
This is how we closed 11/29/2023:
Domestic TTI: +2.02% above its M/A (prior close +1.62%)—Buy signal effective 11/21/2023.
International TTI: +3.54% above its M/A (prior close +3.59%)—Buy signal effective 11/21/2023.
All linked charts above are courtesy of Bloomberg via ZeroHedge.
Contact Ulli