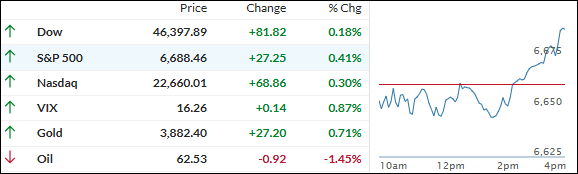
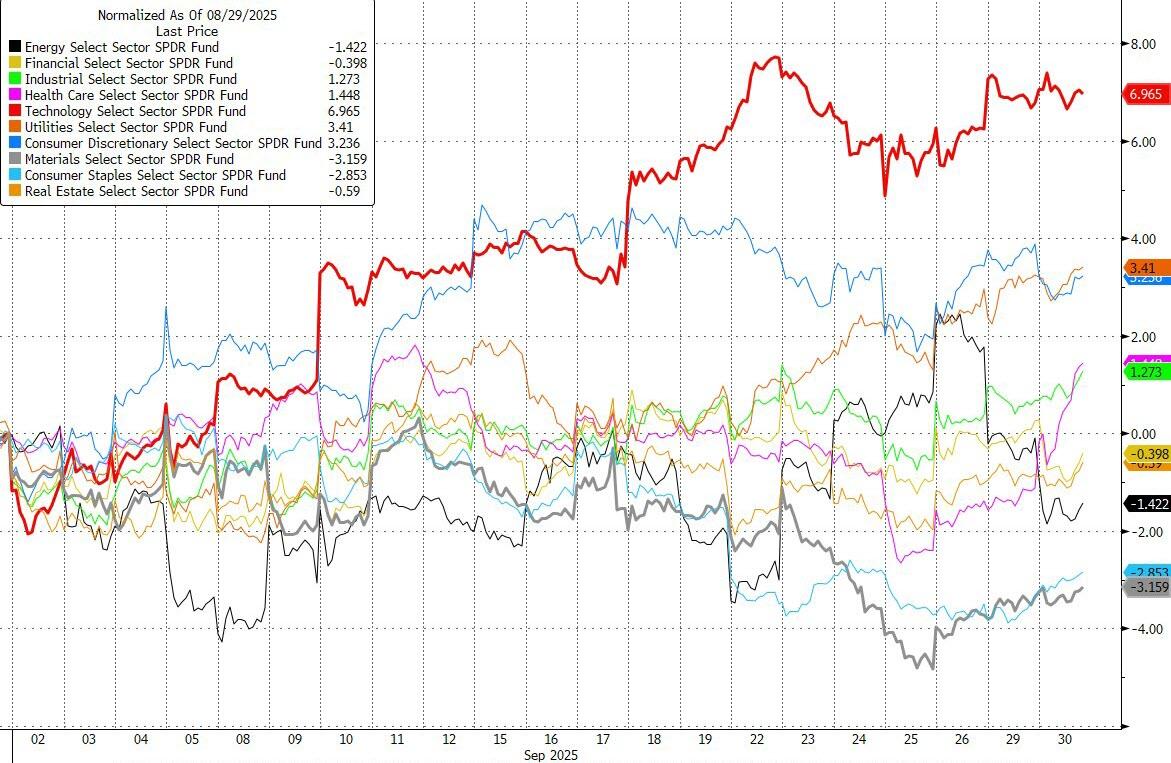
Equites spent most of the day underwater as Wall Street braced for a possible government shutdown, but late-day buying helped the major indexes squeeze out a green close and cap off a better-than-usual September.
Unlike most years, the market sidestepped the usual seasonal weakness—even as headlines warned that this time a shutdown might trigger more volatility, given rising fears about the labor market, stubborn inflation, and high valuations.
While shutdowns rarely move markets for long, traders worry this one could be different—especially since it could delay crucial economic data, like Friday’s jobs report.
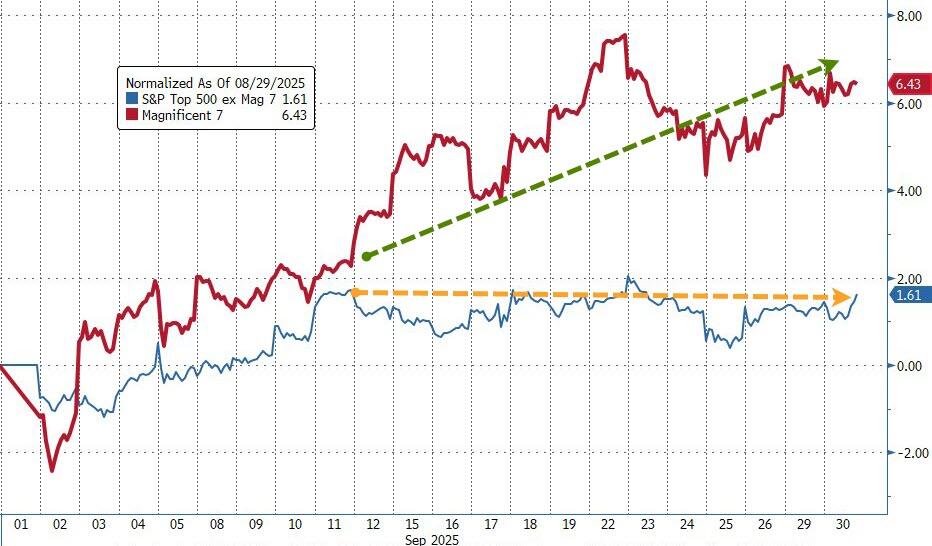
The threat of a credit downgrade and talk of mass federal layoffs didn’t help the mood, but Big Tech still powered ahead: the Mag 7 group outperformed, and tech finished far ahead of the rest of the S&P sectors this month.
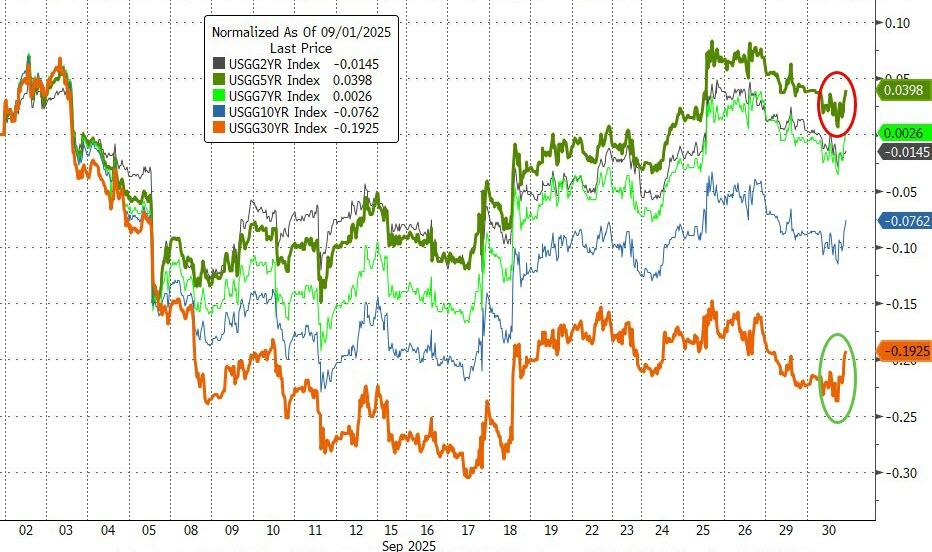
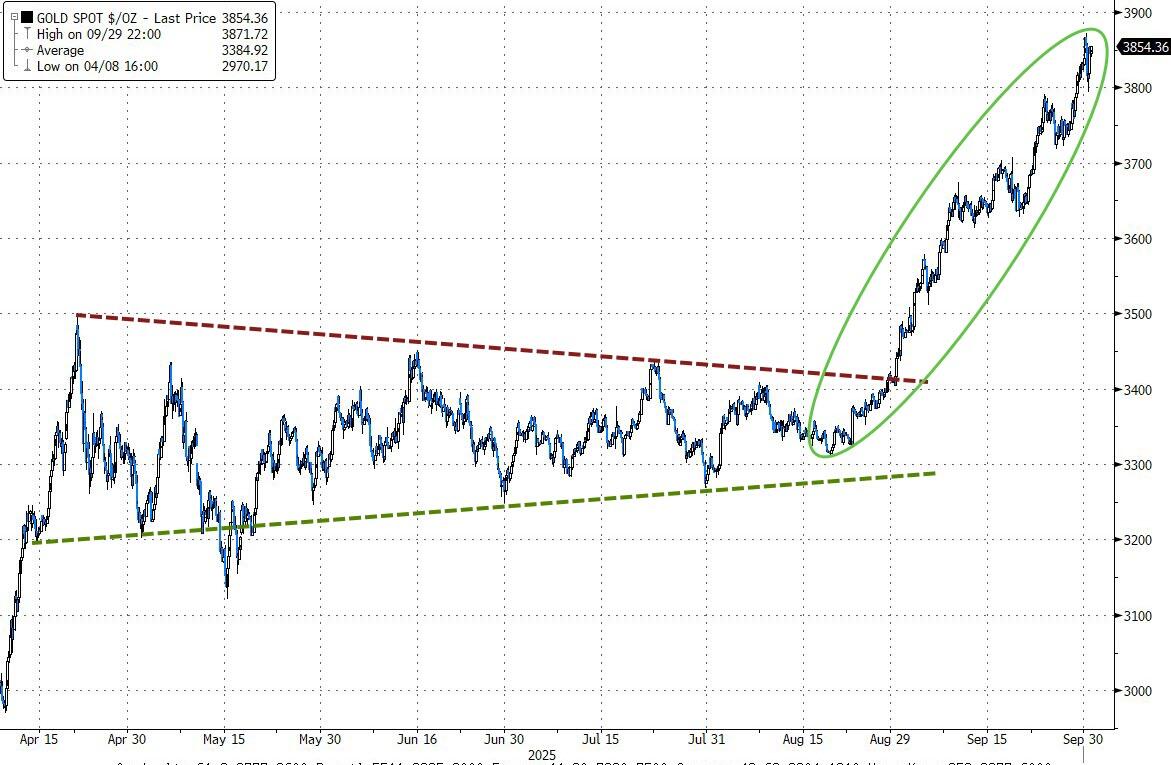
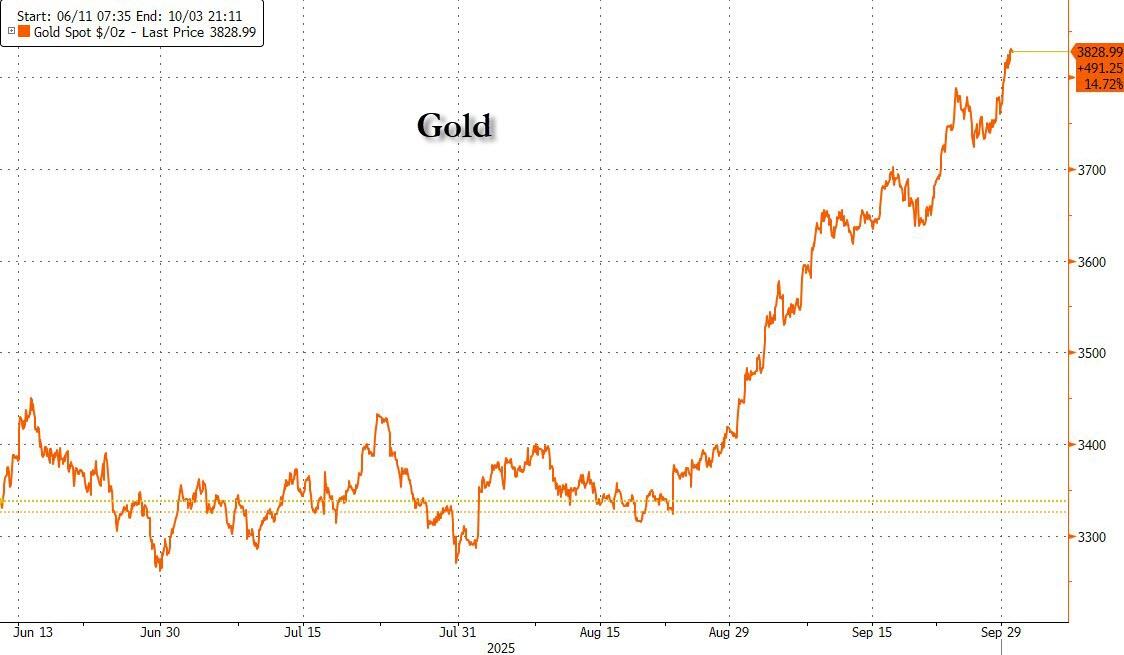
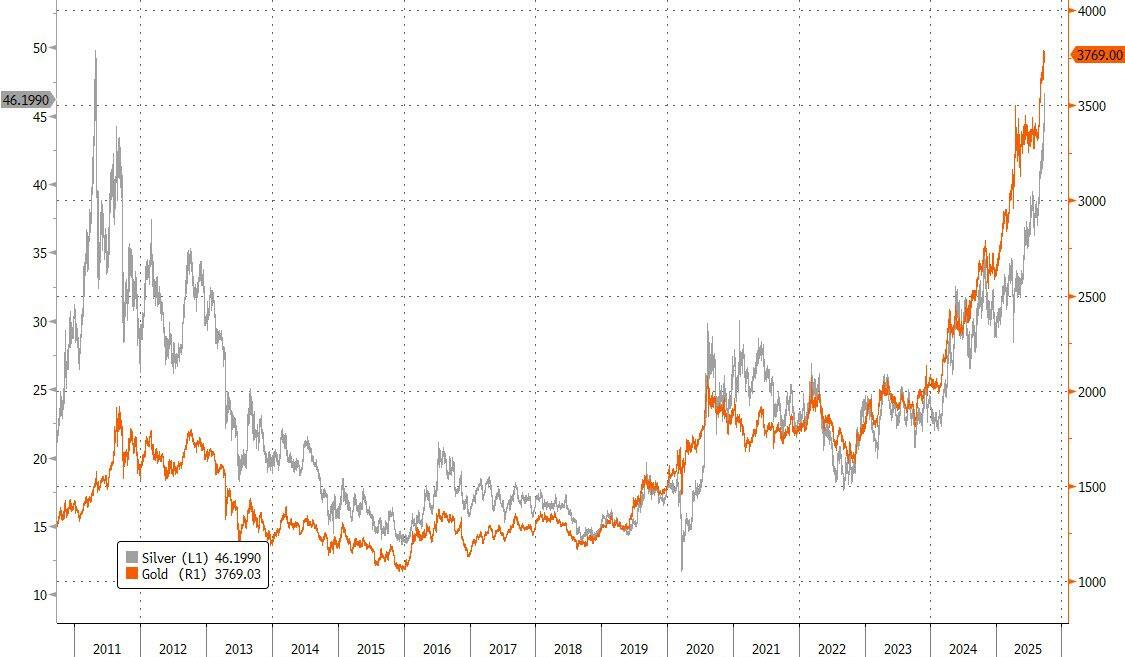
Bond yields were mixed, but precious metals stole the show. Gold notched its best month since 2011, leaping nearly 12% to a new record, and silver rallied 17%.
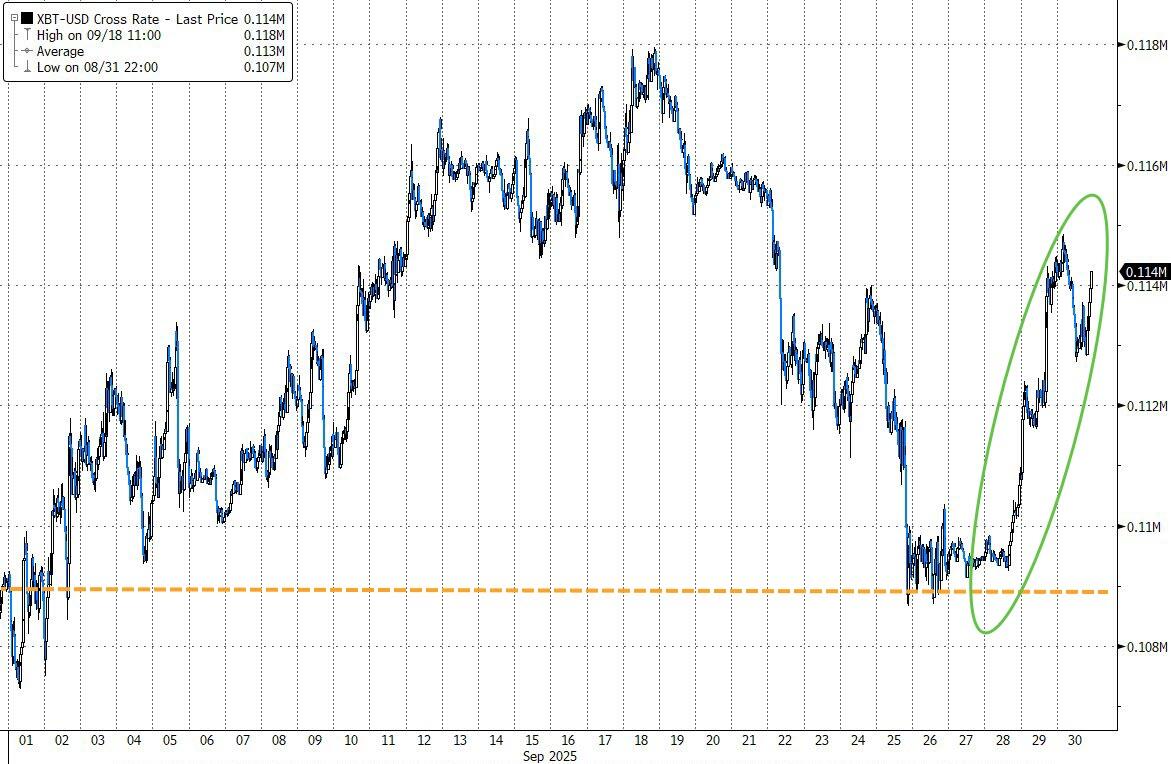
Bitcoin had a bumpy ride but clawed back end-of-month gains, while its ETF trailed the big gains in metals.
Now that September’s chill is behind us, October could bring its own tricks. Can the market keep surprising the skeptics—and what happens if the shutdown drags on?
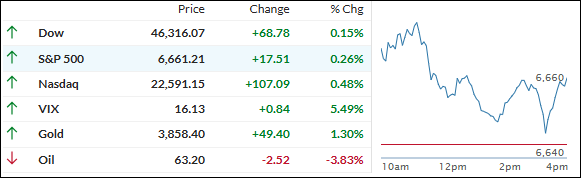
The S&P 500 and Nasdaq started strong today as Wall Street tried to bounce back from last week’s AI scare.
Nvidia led the charge, rallying just over 2% after its partnership with OpenAI sparked new debate about whether big infrastructure spending can keep the AI boom alive.
Advanced Micro Devices and Micron Technology both jumped too, giving the Nasdaq an extra boost thanks to ongoing big-ticket investments in the sector.
But while stocks managed modest gains, all eyes are glued to Washington as another government shutdown looms.
President Trump even warned mass federal layoffs could happen if Congress doesn’t hash out a deal before Tuesday’s midnight deadline—odds now stand at 77% for a shutdown.
Precious metals didn’t disappoint either.
Gold climbed 1.3% to fresh record highs, silver sliced through $47 to gain 1.5%, and copper raced ahead more than 3% on supply worries. Even bitcoin shook off its funk, with its ARKB ETF jumping nearly 5%.
So, here’s the big question: Can metals hold up if a government shutdown sets off bigger market ripples?
Do you want to know which ETFs are hot and which ones are not? Then you need my High-Volume ETF Cutline report. It tells you how close or far each of the 311 ETFs I follow is from its long-term trend line (39-week SMA). These are the ETFs that trade more than $5 million a day, so they are not some obscure funds that nobody cares about.
The report is split into two parts: The winners that are above their trend line (%M/A), and the losers that are below it. The yellow line is the line of shame that separates them. You can see how many ETFs are in each group and how they have changed since the last report (287 vs. 284 current).
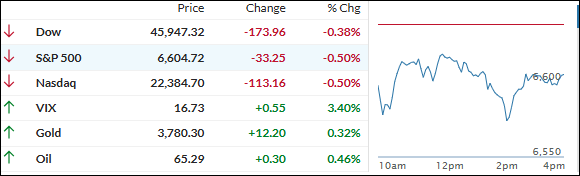
RATE CUT BETS INTACT AS GOLD AND SILVER SHINE, SHUTDOWN ODDS LOOM
[Chart courtesy of MarketWatch.com]
Moving the market
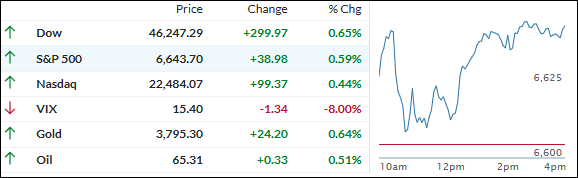
The Dow and S&P 500 got off to a solid start after August’s PCE inflation numbers landed right in line with expectations.
Core inflation ran at 2.9% over the past year—exactly what Wall Street had penciled in—and the broader index came in at 2.7%. Both figures suggest that the Fed’s path for two more rate cuts before year-end is still on track.
After a shaky week, stocks finally tipped higher, snapping a three-day losing streak as dip buyers jumped back in—especially in the Nasdaq, which perked up late in the day.
The jobs data and a stronger GDP reading yesterday put a small damper on bulls but didn’t shake the underlying optimism.
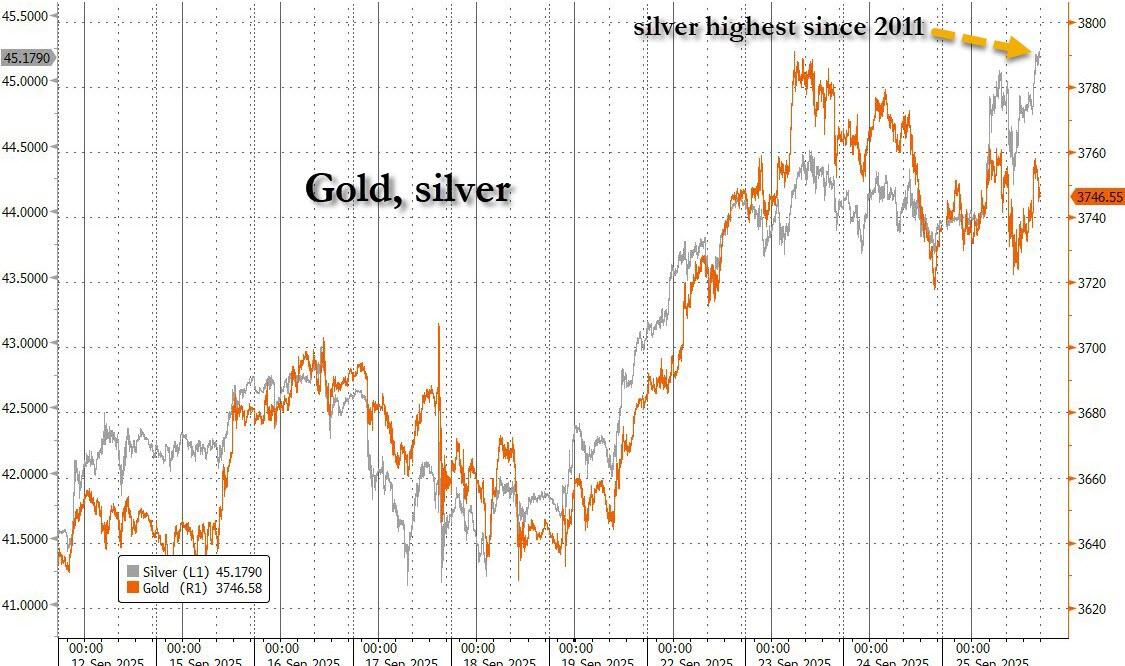
Bond yields held steady, gold smashed through $3,800 (though closed just below), silver cruised over $46, and bitcoin paced quietly.
With shutdown worries running hotter than ever—odds are over 80% now—everyone’s wondering if history will repeat, since past shutdowns have oddly fueled bullish rallies.
Is this calm just the eye of the storm, or will a government shutdown flip the script once again?
ETF Data updated through Thursday, September 25, 2025
How to use this StatSheet:
Out of the 1,800+ ETFs out there, I only pick the ones that trade over $5 million per day (HV ETFs), so you don’t get stuck with a lemon that nobody wants to buy or sell.
Trend Tracking Indexes (TTIs)
These are the main indicators that tell you when to buy or sell Domestic and International ETFs (section 1 and 2). They do that by comparing their position to their long-term M/A (Moving Average). If they cross above, and stay there, it’s a green light to buy. If they fall below, and keep going, it’s a red light to sell. And to make sure you don’t lose your shirt if things go south, I also use a 12% trailing stop loss on all positions in these categories.
All other investment areas don’t have a TTI and should be traded based on the position of each ETF relative to its own trend line (%M/A). That’s why I call them “Selective Buy.” In other words, if an ETF goes above its own trend line, you can buy it. But don’t forget to use a trailing sell stop of 12%, or less if you’re feeling nervous.
If some of these words sound like Greek to you, please check out the Glossary of Terms and new subscriber information in section 9.
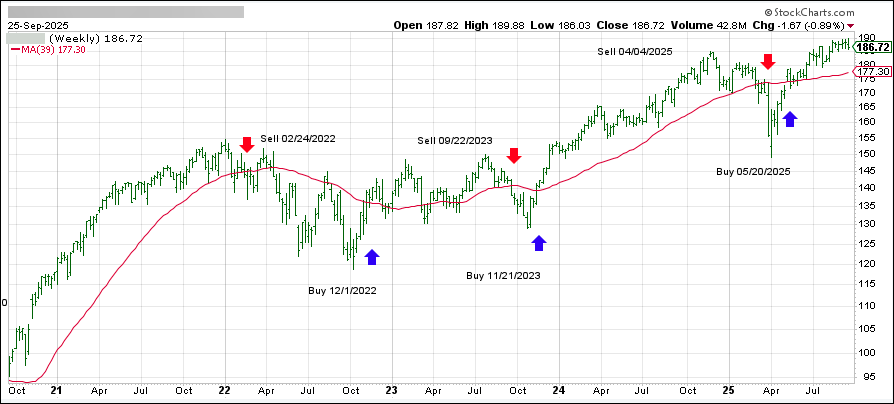
DOMESTIC EQUITY ETFs: BUY— effective 5/20/2025
Click on chart to enlarge
This is our main compass, the Domestic Trend Tracking Index (TTI-green line in the above chart). It has broken above its long-term trend line (red) by +5.05% and remains in “Buy” mode, with our new holdings being subject to our trailing sell stops.
The link below shows all High Volume (HV) Domestic Equity ETFs. They are ranked by M-Index, which is my secret sauce for measuring momentum. Prices in all linked tables below are updated through 09/25/2025, unless otherwise noted. Price data not yet available at publication is indicated with 00.00% or -100.00%. Please note that distributions are not included in the current momentum numbers.
If the TTI is above the trend line, you can use the tables in the link below to pick your winners:
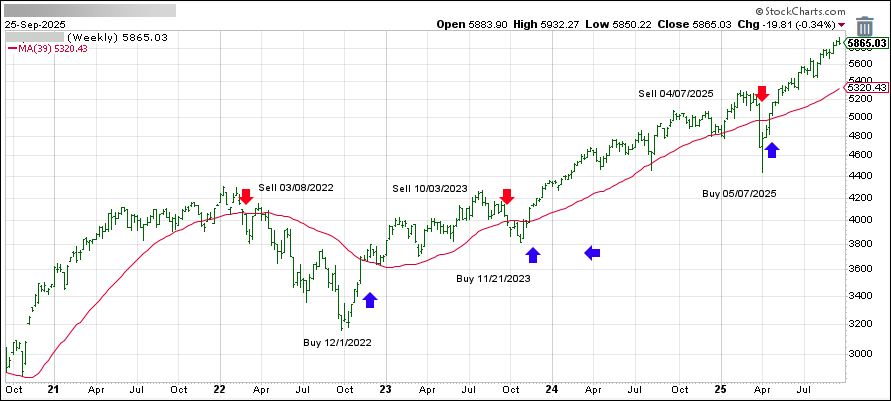
This is our global guide, the International Trend Tracking Index (green). It has broken above its long-term trend line (red) by +10.75% and has been in “Buy” mode since 5/7/2025.
The list in the link below shows the High Volume (HV) International ETFs I track for you during a Buy cycle. They are also ranked by M-Index:
This is the mother of all lists, showing all ETFs I track and how they stack up against each other. The sorting order is by M-Index too. Momentum figures for all ETFs are not adjusted for dividends.
This is where you can find HV ETFs for specific countries or regions that I watch every week. Please note that the data in this table does not include adjustments due to distributions. Country funds can be wild beasts, so make sure you use a trailing stop loss (I use 10%) to protect yourself from nasty bites.
This is where you can diversify your portfolio by looking for different opportunities in various sectors of the market. The table of HV Sector ETFs in the following link covers a wide range of possibilities. The sorting order is by M-Index:
Here too, I recommend using a 10% trailing stop loss to limit your risk.
BOND & DIVIDEND ETFs: SELECTIVE BUY
If you like getting paid for holding ETFs, here’s a list of bond and dividend paying ETFs. But before you buy them, make sure you check their momentum figures first. Then you can visit your favorite financial web site to see their yield and other details.
Please note that the data in this table does not include adjustments due to distributions.
Please note that some of these funds try to beat the index they are tied to by a certain percentage. This can boost your returns, but it can also magnify your losses. So be careful and use a trailing sell stop (I suggest 10%) and be ready for some bumps along the way.
NEW SUBSCRIBER INFORMATION
To get a head start on more successful investing, please click on:
In case you missed it, you can download my latest e-book “How to beat the S&P 500…with the S&P 500,” here. If you are investing your 401k and must use mutual funds, I suggest you mainly stick with the S&P 500 as described in my book. Of course, you can always use the above tables to find sector or country ETFs that suit your taste and use the equivalent mutual funds as offered by your custodian.
Disclosure:
I must tell you that I, as well as my advisory clients, own some of the ETFs listed in the above table. Also, they are not meant to be specific investment recommendations for you, they just show which ETFs from my universe are doing well right now.
Stocks stumbled for a third day in a row as the latest pullback in Oracle and a fresh jump in rates weighed on sentiment.
Oracle slid another 4% and is now down more than 10% from its recent high, rattled by lingering doubts about the AI story and a new sell rating from Wall Street predicting a much deeper drop ahead.
That’s triggered fresh worries that investors are overestimating how much AI deals will really move the needle for Oracle’s cloud business.
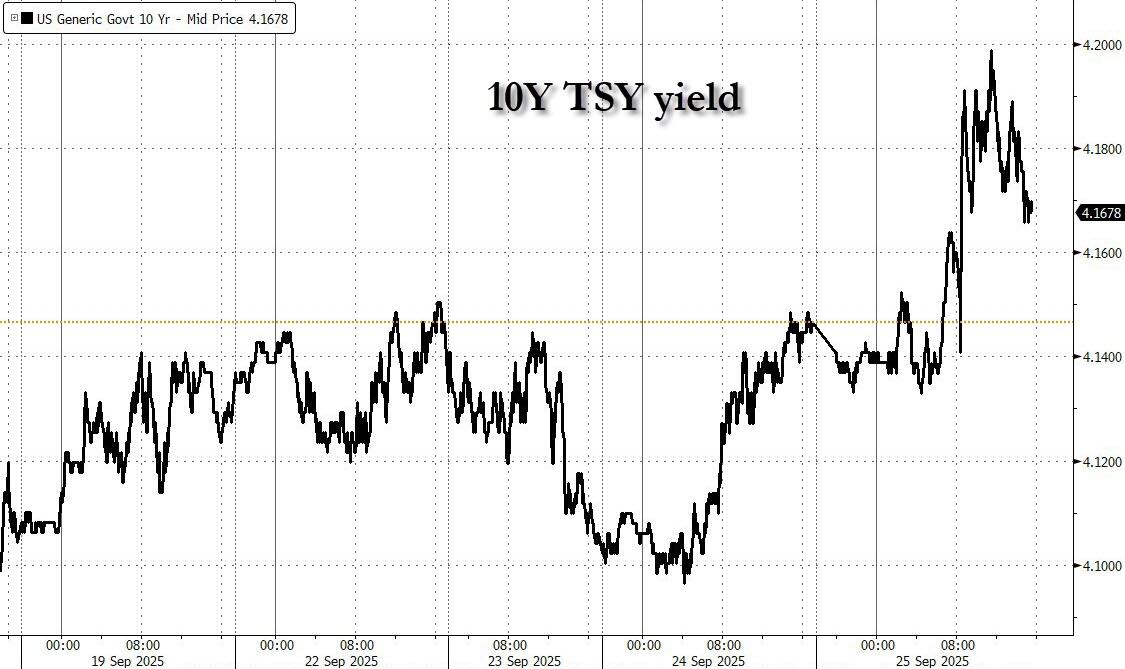
Rising yields didn’t help, as the 10-year Treasury rate ticked up to 4.18% after stronger-than-expected jobless claims and a big upward revision to second-quarter GDP.
With economic data still coming in hot, traders are getting nervous that the Fed could pause on rate cuts—pulling the rug out from under the bulls just as the market was hoping for more easing.
Caution remains high with inflation numbers due tomorrow and new jitters about a potential government shutdown swirling.
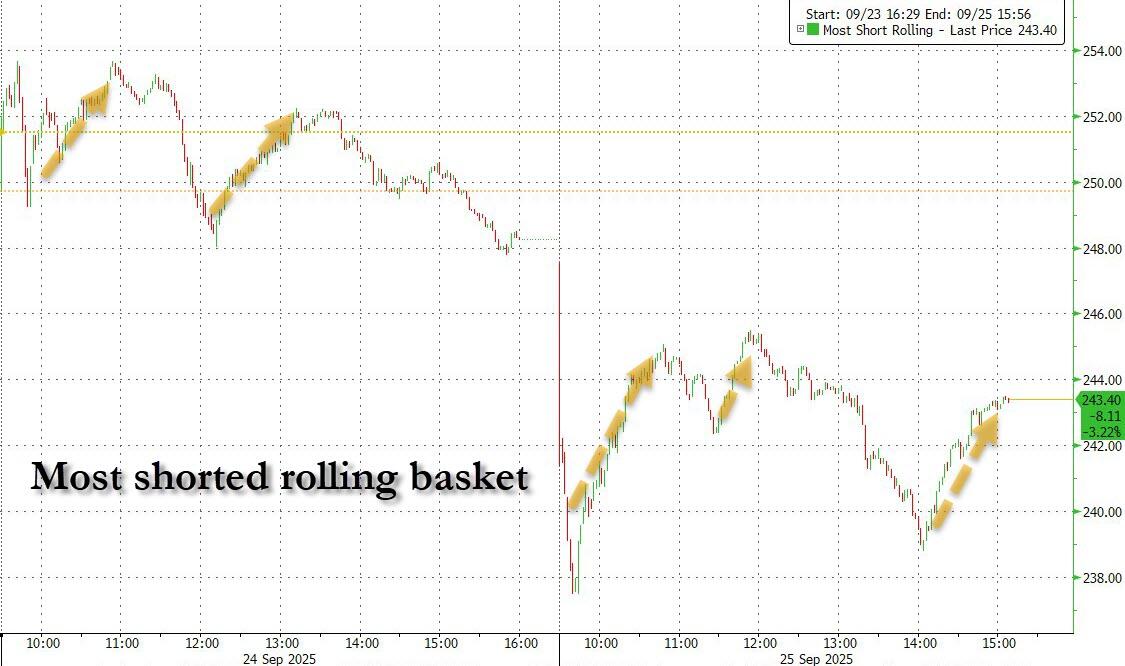
Even multiple short squeeze attempts fizzled out, leaving the bears firmly in control by the close.
The only real pockets of green came from precious metals: gold edged higher, and silver crushed a 14-year high above $45. Meanwhile, bitcoin took a nosedive below $110k as Fed cut hopes faded.
So, is this just another September shakeout—or the start of a longer stay for the bears?