ETF Tracker Newsletter For December 8, 2023

Ulli ETF Tracker Contact

ETF Tracker StatSheet          

You can view the latest version here.

THE ECONOMY IS JUST RIGHT, BUT WILL IT LAST?

[Chart courtesy of MarketWatch.com]
  1. Moving the markets 

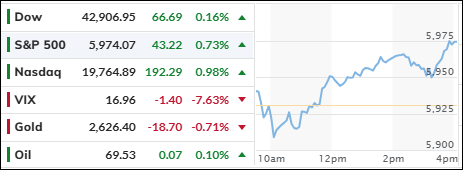
The stock market had a good day after two reports showed that the economy is doing well but not too well. The November jobs report and the University of Michigan consumer survey both indicated that the economy is growing at a steady pace and inflation is easing. This is what the Fed and many investors want: a soft landing, not a crash or a boom.

The unemployment rate dropped to 3.7% in November, beating expectations. The economy added 199,000 jobs, more than forecasted and more than in October.

These numbers could have worried some people that the economy is overheating, and the Fed will have to raise interest rates more aggressively. But some optimistic traders think the opposite: that the Fed will start cutting rates as soon as March.

We’ll have to wait and see if they are right or if inflation will come back to haunt us, which I believe it will. The Fed has been raising rates for a while now, and that has pushed up the dollar and pushed down commodities.

It has also made bonds less attractive and stocks more volatile. This week, stocks swung wildly, with small caps and big tech doing better than the rest. Gold fell but held above $2,000, while oil bounced back from a six-day slump.

So, what’s next for the market? Will it keep rising or fall off a cliff? Will the Fed ease or tighten? Will inflation stay low or spike up?

These are the questions that keep traders awake at night. And the answers are not easy to find. As ZeroHedge asked: “Which comes first—the equity market collapse or global central bank balance sheet explosion?

This chart shows the dilemma, but my guess is the former.

Read More

Weekly StatSheet For The ETF Tracker Newsletter – Updated Through 12/07/2023

Ulli ETF StatSheet Contact

ETF Data updated through Thursday, December 7, 2023

How to use this StatSheet:

  1. Out of the 1,800+ ETFs out there, I only pick the ones that trade over $5 million per day (HV ETFs), so you don’t get stuck with a lemon that nobody wants to buy or sell.
  1. Trend Tracking Indexes (TTIs)

These are the main indicators that tell you when to buy or sell Domestic and International ETFs (section 1 and 2). They do that by comparing their position to their long-term M/A (Moving Average). If they cross above, and stay there, it’s a green light to buy. If they fall below, and keep going, it’s a red light to sell. And to make sure you don’t lose your shirt if things go south, I also use a 12% trailing stop loss on all positions in these categories.

  1. All other investment areas don’t have a TTI and should be traded based on the position of each ETF relative to its own trend line (%M/A). That’s why I call them “Selective Buy.” In other words, if an ETF goes above its own trend line, you can buy it. But don’t forget to use a trailing sell stop of 12%, or less if you’re feeling nervous.

If some of these words sound like Greek to you, please check out the Glossary of Terms and new subscriber information in section 9.

  1. DOMESTIC EQUITY ETFs: BUY— since 11/21/2023

Click on chart to enlarge

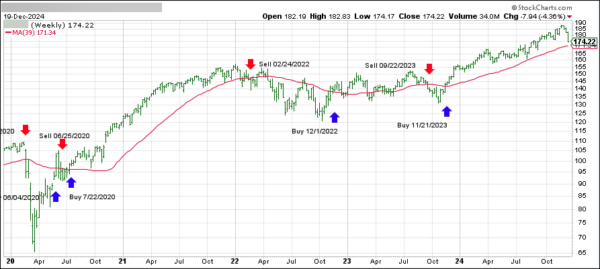
This is our main compass, the Domestic Trend Tracking Index (TTI-green line in the above chart). It has now broken above its long-term trend line (red) by +4.08% and has generated a new “Buy” as posted.

Read More

Alphabet’s New AI Lifts S&P 500; Currency Market Sees Wild Swings Before Jobs Report

Ulli Market Commentary Contact

[Chart courtesy of MarketWatch.com]

  1. Moving the markets 

The S&P 500 bounced back from a three-day slump and closed higher on Thursday, as investors awaited the crucial jobs report on Friday. Google-parent Alphabet led the gains with a 5% jump, thanks to its new Gemini AI model that promises to revolutionize search and advertising. Chipmakers Nvidia and AMD also rose by 1% and 5%, respectively, as demand for their products remained strong.

The jobs report is the main event of the week, as it will reveal the health of the labor market amid mixed signals from other data. On Thursday, the weekly jobless claims came in lower than expected and the continuing claims dropped, suggesting that fewer people are losing their jobs. However, this also raised concerns about inflation and the Fed’s tapering plans, pushing the 10-year treasury yield higher.

Investors are hoping for a Goldilocks scenario on Friday, where the jobs report shows a moderate increase in hiring, but not too strong to spook the Fed. Economists forecast that 190,000 jobs were added in November, up from 128,000 in October. A weaker number could ease the pressure on the Fed to hike interest rates sooner, while a stronger number could dampen the market mood.

Meanwhile, the currency market saw some wild swings on Thursday, starting with the Bank of Japan’s hawkish comments that sent the yen soaring against the dollar. The USDJPY pair plunged and briefly flash crashed, as this chart shows. It recovered some of its losses, but still ended the day lower. The Swiss franc also surged to new highs, while the dollar index fell to its lowest level in three weeks.

Other markets were more subdued, with bond yields mixed, gold flat, and oil prices slightly higher. Oil snapped a five-day losing streak but failed to reclaim the $70 mark.

The bright spot of the day was the mortgage market, where rates fell for the sixth consecutive week and hit their lowest level since August.

How long will this last?

Read More

Market Fizzles Out As Economic Data Sends Mixed Signals

Ulli Market Commentary Contact

[Chart courtesy of MarketWatch.com]

  1. Moving the markets 

The stock market had a roller-coaster ride on Wednesday, as investors weighed the mixed signals from the latest economic data. On one hand, inflation seemed to be cooling, as labor costs fell, and productivity rose more than expected. On the other hand, the job market showed signs of slowing down, as private payrolls grew less than forecasted. These data points set the stage for the upcoming jobs report on Friday, which could have a big impact on the Fed’s policy decisions.

The market opened higher, boosted by lower inflation pressure and higher productivity growth. However, the rally faded as bond yields diverged, with the long-term rates dropping to their lowest level since August. The tech sector also lost steam, as the so-called “Magnificent 7” stocks gave up their early gains, while the unprofitable tech stocks continued to surge. The short-squeeze attempts failed to lift the market, and the major indexes ended the day in the red.

The dollar edged higher, along with gold, which bounced back from the 2,020-support level. Crude oil extended its losing streak to five days, as financial conditions loosened, reversing the tightening that occurred from August to October.

Fed chair Powell had previously said that the market was doing the job for him (tightening), but now that the market has undone most of that job, will the Fed have to step in and intervene?

Read More

Nasdaq Outperforms As Liquidity Divergence Widens

Ulli Market Commentary Contact

[Chart courtesy of MarketWatch.com]

  1. Moving the markets 

The stock market seemed to be in a daze as it drifted sideways without a clear direction. After a strong rally in the past weeks, investors seemed to lose their enthusiasm and confidence. The previous session ended with losses for the major indexes, raising doubts about the sustainability of the market’s momentum. Despite the recent slump, the indexes are still up for the quarter, showing how impressive the market’s performance was before this week.

The market got a slight boost on Tuesday as the tech sector recovered some of its losses, lifting the Nasdaq into the green zone. The 10-year Treasury yield also dropped below the critical 4.2% mark, signaling a cooling off in the labor market. This came after a disappointing report on job openings, which showed a sharp decline and a downward revision of previous data. The Citi Economic Surprise index continued to slide, reflecting the gap between expectations and reality.

Meanwhile, traders are still betting on five rate cuts next year, which seems overly optimistic and wishful. Such a scenario would imply a severe economic and financial crisis, which is not very likely. BlackRock, the world’s largest asset manager, expects only one rate cut, and not until the second half of 2024.

Bond yields slipped, but the 10-year and 30-year remained above Friday’s lows, indicating some resilience in the bond market. Financial conditions also eased significantly, creating a favorable environment for borrowing and lending.

The Nasdaq managed to overcome its early weakness thanks to the rebound of the “Magnificent 7” stocks, which are the seven most influential tech companies in the market. The dollar rallied for the second day in a row, while gold retreated from its record highs two days ago.

Liquidity is the key factor that drives the market movements. This chart shows the relationship between liquidity and the stock market, but it also raises a question: “How long can this divergence last?

Read More

Markets Slip, Bitcoin And Gold Shine, Nvidia Sells: What’s Going On?

Ulli Market Commentary Contact

[Chart courtesy of MarketWatch.com]

  1. Moving the markets 

The markets had a case of the Mondays, as they dipped after five weeks of gains. But they didn’t give up easily and bounced back in the afternoon to minimize the damage.

While stocks were having a hard time, bitcoin and gold were having a party in overnight trading. Bitcoin soared past $41,000 to hit a 19-month high, while gold reached its highest level ever before dropping during the day.

Monday’s moves were a sign of caution after a strong run in the market. Tech stocks took a hit, with Nvidia, Alphabet and Meta all losing more than 2%.

The market rally since late October was fueled by traders betting that the Fed will cut interest rates next year. They kept this belief last week even as Fed Chair Jerome Powell tried to cool them down, saying it’s too early to think about easing policy. In other words, they ignored him.

Weak economic data, such as US factory orders falling the most since Covid lockdowns, dragged the Citi Economic Surprise index lower, as financial conditions turned sour in October and never recovered.

Bond yields rose from Friday’s low, with the 2-year jumping 14 basis points, while the dollar ran faster.

We also found out that Nvidia, the Wall Street tech darling, filed paperwork to sell 370,000 shares held by insiders, despite their stellar 3rd quarter earnings.

What do they know that we don’t? Or are we heading for an AI bust, as this chart suggests?

Read More