Dismal Economic Data: Bonds Rally; Equities Inch Up

Ulli Market Commentary Contact

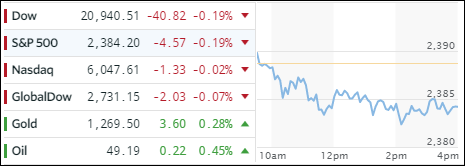
[Chart courtesy of MarketWatch.com]
  1. Moving the Markets

Economic data point releases were anything but awe inspiring with auto sales looking “less like a plateau and more like debt-fueled bubble on the verge of an epic collapse,” as ZH succinctly put it. Even hope for an April surprise ended in disappointment as OEMs did not even come close to estimates. Other factoids included sluggish consumer spending, reduced lending activity and slipping earnings expectations.

As a result, it’s no surprise that equities went back into a sideways trading range with uncertainty about Apple’s earnings and the Fed announcement being on traders’ minds. Still, the major indexes were pushed higher into the close via a VIX (volatility index) slam thereby assuring a “green” close.

Automakers headed south joined by banks as Trump’s break-up chatter (of the too big to fail banks) was on everyone’s minds. Bonds rallied with TLT gaining +0.51% while the US dollar went sideways and continues to hug its 200-day M/A. The energy complex got hammered again stumbling to their lowest since November; oil continued its slide and has now reached 6-month lows.

Read More

Tech Sector Saves The Day

Ulli Market Commentary Contact

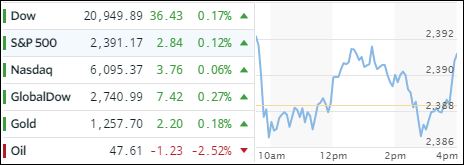
[Chart courtesy of MarketWatch.com]
  1. Moving the Markets

While the Nasdaq and S&P 500 hovered above their respective unchanged lines all day, the Dow see-sawed and dove into the close for a slight loss. The Nasdaq was the savior with a solid +0.73% gain, but it also threw an assist to the S&P thereby helping it to close in the green. However, volume was the lowest of 2017 and 40% below 2016’s May Day volume.

Economic data points for manufacturing and personal income/spending were less than expected contributing to the loss of upward momentum, which dominated market sentiment all of last week.

Caution was the word of the day in the markets as a variety of upcoming events certainly could upset the bullish crowd. Here are some of them:

  1. Fed decision on interest rates (Wed)
  2. The April Labor report (Fri)
  3. The ongoing Debt Ceiling debacle (Fri)
  4. The second round of the French elections with the run off scheduled for this coming Sunday

Read More

One Man’s Opinion: Stockman: The Trump Reflation Fantasy Ends On Day 100

Ulli Market Review Contact

By David Stockman

In honor of the Donald’s “Mother of All Bomb” (MOAB) attack on the Hindu Kush mountains Thursday, let me introduce MOAD.

I’m referring to the “Mother of All Debt” crises, of course. The opening round is coming when Washington goes into shutdown mode on April 28, which happens to be Day 100 of the Donald’s reign.

In theory, this should be just a routine extension of the fiscal year (FY) 2017 continuing resolution (CR) by which Congress is funding the $1.1 trillion compartment of government which is appropriated annually.

The remaining $3 trillion per year of entitlements and debt service is on automatic pilot, but the truth is Washington can’t agree on what to do about either component — except to keeping on borrowing to pay the bills.

There is a problem with this long-running game of fiscal kick-the-can, however. Namely, a 100 year-old statute requires Congress to raise the ceiling for treasury borrowing periodically, but the Imperial City has now reached the point in which there is absolutely no way forward to accomplish this.

Read More

ETFs On The Cutline – Updated Through 04/28/2017

Ulli ETFs on the Cutline Contact

Below please find the latest High Volume ETFs Cutline report, which shows how far above or below their respective long-term trend lines (39 week SMA) my currently tracked ETFs are positioned.

This report covers the HV ETF Master List from Thursday’s StatSheet and includes 366 High Volume ETFs ETFs, defined as those with an average daily volume of more than $5 million, of which currently 252 (last week 256) are hovering in bullish territory. The yellow line separates those ETFs that are positioned above their trend line (%M/A) from those that have dropped below it.

Take a look:

The HV ETF Master Cutline Report            

In case you are not familiar with some of the terminology used in the reports, please read the Glossary of Terms.

If you missed the original post about the Cutline approach, you can read it here.

ETF Tracker Newsletter For April 28, 2017

Ulli ETF Tracker Contact

ETF Tracker StatSheet

https://theetfbully.com/2017/04/weekly-statsheet-etf-tracker-newsletter-updated-04272017/

MARKETS EKE OUT A GAIN DURING THE LAST WEEK OF THE MONTH

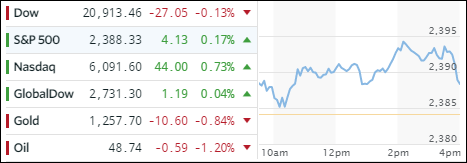
[Chart courtesy of MarketWatch.com]
  1. Moving the Markets

The aimless meandering to the downside during the first 3 weeks of April is now in the rear view mirror as the last 5 trading days combined to pull the markets above the unchanged line for the month, or +0.9% in the case of the S&P 500. This week turned out to be the best for stocks for the year, although volume was abysmal for the past two days.

Hard to make some sense out of that fact as economic performance, when measured by the GDP, collapsed to an embarrassing 0.7%; and that is the officially admitted number, which makes me wonder if the real one is still on the positive side of the ledger.

In the end, technology was April’s winner, energy turned into the big laggard, while the Dollar index headed south for the 2nd month in a row. As I mentioned before, the banks continued slipping and are down ever since Trump announced his tax plan. Interestingly, the 30-year yield hit its glass ceiling (the 3.00% level) five times this week without breaking through confirming the theme that higher rates continue to be on the horizon.

Read More

Weekly StatSheet For The ETF Tracker Newsletter – Updated Through 04/27/2017

Ulli ETF StatSheet Contact

ETF Data updated through Thursday, April 27, 2017

Methodology/Use of this StatSheet:

  1. From the universe of over 1,800 ETFs, I have selected only those with a trading volume of over $5 million per day (HV ETFs), so that liquidity and a small bid/ask spread are assured.
  2. Trend Tracking Indexes (TTIs)

Buy or Sell decisions for Domestic and International ETFs (section 1 and 2), are made based on the respective TTI and its position either above or below its long-term M/A (Moving Average). A crossing of the trend line from below accompanied by some staying power above constitutes a “Buy” signal. Conversely, a clear break below the line constitutes a “Sell” signal. Additionally, I use a 7.5% trailing stop loss on all positions in these categories to control downside risk.

  1. All other investment arenas do not have a TTI and should be traded based on the position of the individual ETF relative to its own respective trend line (%M/A). That’s why those signals are referred to as a “Selective Buy.” In other words, if an ETF crosses its own trendline to the upside, a “Buy” signal is generated. Since these areas tend to be more volatile, I recommend a wider trailing sell stop of 7.5% -10% depending on your risk tolerance.

If you are unfamiliar with some of the terminology, please see Glossary of Terms and new subscriber information in section 9.


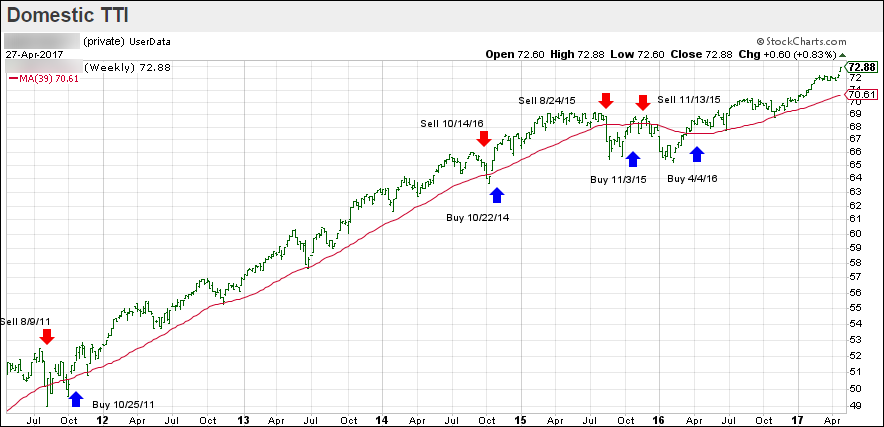
  1. DOMESTIC EQUITY ETFs: BUY — since 4/4/2016

Click on chart to enlarge

Our main directional indicator, the Domestic Trend Tracking Index (TTI-green line in the above chart) is positioned above its long-term trend line (red) by +3.32% after having generated a new Domestic Buy signal effective 4/4/2016 as posted.

Read More