ETF Tracker Newsletter For August 25, 2017

Ulli ETF Tracker Contact

ETF Tracker StatSheet

https://theetfbully.com/2017/08/weekly-statsheet-etf-tracker-newsletter-updated-08242017/

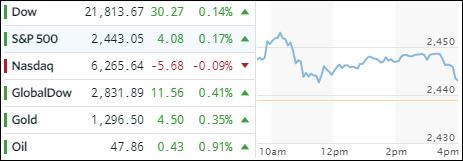
SNAPPING A TWO-WEEK LOSING STREAK
[Chart courtesy of MarketWatch.com]
  1. Moving the Markets

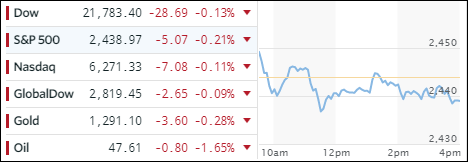
Anticipation was high ahead of speeches by Yellen and Draghi, which was reflected in the early rally right after the markets opened. However, disappointment set in as neither one offered any clues about future monetary policy moves. Despite an ugly last hour dive in the indexes, we not only managed to stay above the unchanged line (except the Nasdaq) but also snapped a two-week losing streak.

Equities were in rally mode joined by bonds and precious metals. Interest rates retreated, and the 20-year bond (TLT) sprinted ahead +0.39%. Gold inched higher but did not manage a close above the $1,300 level. The Nasdaq was the weakling of the day causing Semiconductors (SMH) to retreat -0.31% in an otherwise bullish environment. The FANG stocks dropped as well for the day and for the week.

All equity ETFs did well with Transportations (IYT) taking the win with +1.14%. That was followed by Emerging Markets (SCHE) with +0.78% and International SmallCaps (SCHC) adding +0.73%. The US dollar (UUP) traded in a broad range and ended up being the whipping boy again by dumping -0.83% to its lowest close since May last year. YTD, it’s now down over 10%.
Read More

Weekly StatSheet For The ETF Tracker Newsletter – Updated Through 08/24/2017

Ulli ETF StatSheet Contact

ETF Data updated through Thursday, August 24, 2017

Methodology/Use of this StatSheet:

  1. From the universe of over 1,800 ETFs, I have selected only those with a trading volume of over $5 million per day (HV ETFs), so that liquidity and a small bid/ask spread are assured.
  2. Trend Tracking Indexes (TTIs)

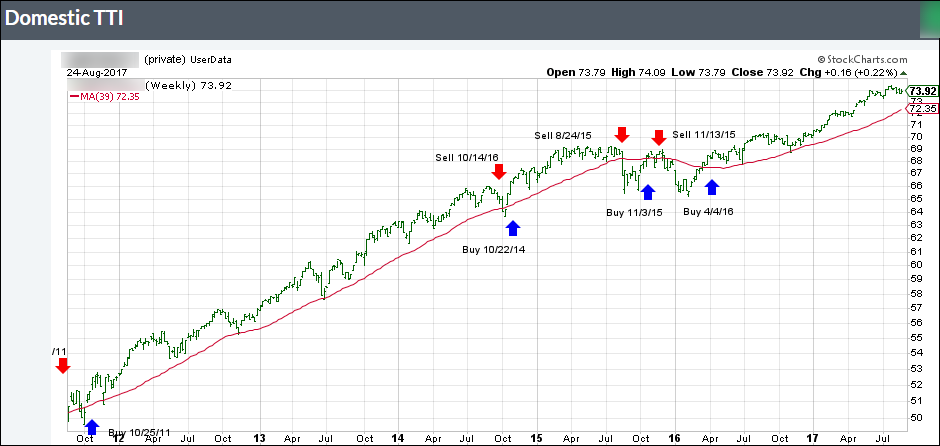
Buy or Sell decisions for Domestic and International ETFs (section 1 and 2), are made based on the respective TTI and its position either above or below its long-term M/A (Moving Average). A crossing of the trend line from below accompanied by some staying power above constitutes a “Buy” signal. Conversely, a clear break below the line constitutes a “Sell” signal. Additionally, I use a 7.5% trailing stop loss on all positions in these categories to control downside risk.

  1. All other investment arenas do not have a TTI and should be traded based on the position of the individual ETF relative to its own respective trend line (%M/A). That’s why those signals are referred to as a “Selective Buy.” In other words, if an ETF crosses its own trendline to the upside, a “Buy” signal is generated. Since these areas tend to be more volatile, I recommend a wider trailing sell stop of 7.5% -10% depending on your risk tolerance.

If you are unfamiliar with some of the terminology, please see Glossary of Terms and new subscriber information in section 9.


  1. DOMESTIC EQUITY ETFs: BUY — since 4/4/2016

Click on chart to enlarge

Our main directional indicator, the Domestic Trend Tracking Index (TTI-green line in the above chart) is positioned above its long-term trend line (red) by +2.31% after having generated a new Domestic Buy signal effective 4/4/2016 as posted.

Read More

Stock Stumble Continues

Ulli Market Commentary Contact

[Chart courtesy of MarketWatch.com]
  1. Moving the Markets

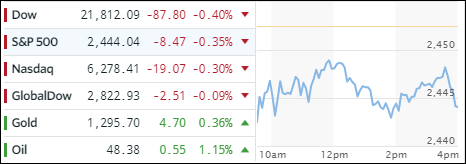
Even though the day started on the plus side for the major indexes, early upward momentum was not sustainable as miserable housing data, for the second day in a row, gave the bears something to cheer about. Uncertainty continued as the debt-ceiling-battle between Trump and McConnell showed no compromise and threw doubt on an amicable solution. And last not least, the energy complex tuned chaotic with Hurricane Harvey threatening to near landfall.

In the end, the major indexes ended up vacillating tightly around the unchanged line and closing slightly below it. Slipping the most were Transportations (IYT) with -0.64%. On the plus side, Emerging Markets (SCHE) added +0.34% while SmallCaps (SCHA) gained +0.18%.

With uncertainty keeping a leash on any market advances, bonds slipped with the 20-year T-Bond (TLT) losing -0.37%. The US dollar (UUP) traded in a tight range and ended higher by +0.21%. Gold dropped a tad and remains in a tight trading range just below its $1,300 milestone marker.

Read More

Rally Peters Out…

Ulli Market Commentary Contact

[Chart courtesy of MarketWatch.com]
  1. Moving the Markets

After yesterday’s euphoric rally, reality set in and pulled the indexes off their lofty levels. To be clear, the pullback was relatively benign compared to the gains. Contributing to the uneasiness was President Trump’s threat to shut down the government should congress continue to stonewall his efforts to build a wall along the Mexican border. In cased you don’t remember “the wall” was one of Trump’s campaign centerpieces.

All this demonstrates is how fragile the current environment is given that the upcoming debt ceiling debate looks to be a very contentious event. Of course, all this jawboning can’t hide the fact that in past years, a common ground was always found to make sure the limit to the US credit card was raised by a sufficient margin to continue reckless spending.

Across the ETF spectrum, there were more winners than losers. On the plus side, we saw Emerging Markets (SCHE) score a nice gain of +0.60%, while Semiconductors (SMH), despite the Nasdaq’s loss, closed in the green by +0.21%. On the losing side, Transportations (IYT) fared the worst with -1.33%, followed by the Dividend ETF (SCHD) with -0.35%.

Gold and bonds rallied in sync with gold adding +0.36% but still remaining below its $1,300 level. As yields dropped, the 20-year bond advanced and gained +0.68%, which is its highest level since late June. Bucking the trend was the US dollar (UUP) as it lost -0.41% for the day and -9.9% YTD.

Read More

Dow & S&P Score Best Daily Rise In Four Months

Ulli Market Commentary Contact

[Chart courtesy of MarketWatch.com]
  1. Moving the Markets

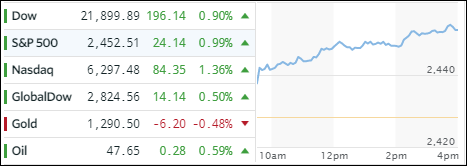
Some White House mumbling about Trump’s tax reform along with renewed war mongering from last night’s speech combined to provide the fuel to drive today’s rally enabling the Dow and S&P 500 to notch their best daily gain in some four months, but the Nasdaq was the session’s top performer with +1.36%.

Across our ETF holdings, we saw nothing but green numbers. Semiconductors (SMH) took top billing by gaining +1.34%, which was closely followed by LargeCaps (SCHX) with +1.02%. The low man on the “green” totem pole was International SmallCaps (SCHC) with +0.41%.

When we are in “risk-on” mode, safe havens will suffer and today was no exception. Bonds headed south, as yields rose, with the 20-year T-bond surrendering -0.39%. Gold joined in and gave back -0.48% as the US dollar (UUP) rose +0.41%.

Today represented a nice bounce off last Friday’s lows, but it’s too early to tell if this was just a short-term rebound within a longer term correction, or the resumption of the major uptrend.

Read More

Searching For Direction

Ulli Market Commentary Contact

[Chart courtesy of MarketWatch.com]
  1. Moving the Markets

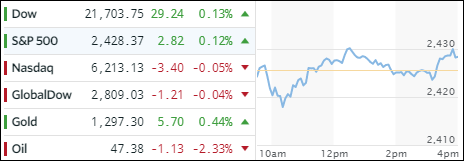
It was another session during which the major indexes danced around their respective unchanged lines. Early losses were wiped out for the most part, and we managed to eke out a tiny gain with the exception of the Nasdaq, which closed slightly in the red.

In the ETF spectrum that we are invested in, Transportations (IYT) took the lead with +0.40%, followed by the Dividend ETF (SCHD), which added +0.33%. Lagging behind, but ending the day in the green, were the International SmallCaps (SCHC) with +0.15% and International Equities (SCHF) with +0.06%. With the Nasdaq showing weakness, it’s no surprise that Semiconductors (SMH) ended down -0.37%.

Low volume marked the session and added to the aimless meandering, which also found support from continued geopolitical tensions and political turmoil in Washington. The bulls remained cautious and defensive sectors benefited. Gold was one of those areas, and the shiny metal is again knocking against its $1,300 glass ceiling for the third time this year.

The 10-year bond yield dropped again and has now reached a level last seen in June. It’s a clear sign that economically speaking things may not be what they appear as presented in MSM. The US Dollar (UUP) had recently bounced off the August 1 lows, but seems to have resumed the downtrend and is now approaching that low from above. On the weekly chart, it has now also broken his 200-day M/A, which has not happened since August 2014. It looks to be a bear market in the making.

Read More