
ETF Tracker StatSheet
https://theetfbully.com/2017/08/weekly-statsheet-etf-tracker-newsletter-updated-08242017/
SNAPPING A TWO-WEEK LOSING STREAK
- Moving the Markets
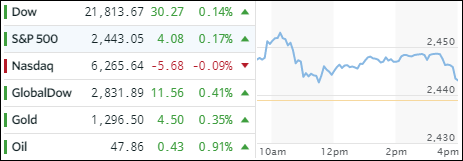
Anticipation was high ahead of speeches by Yellen and Draghi, which was reflected in the early rally right after the markets opened. However, disappointment set in as neither one offered any clues about future monetary policy moves. Despite an ugly last hour dive in the indexes, we not only managed to stay above the unchanged line (except the Nasdaq) but also snapped a two-week losing streak.
Equities were in rally mode joined by bonds and precious metals. Interest rates retreated, and the 20-year bond (TLT) sprinted ahead +0.39%. Gold inched higher but did not manage a close above the $1,300 level. The Nasdaq was the weakling of the day causing Semiconductors (SMH) to retreat -0.31% in an otherwise bullish environment. The FANG stocks dropped as well for the day and for the week.
All equity ETFs did well with Transportations (IYT) taking the win with +1.14%. That was followed by Emerging Markets (SCHE) with +0.78% and International SmallCaps (SCHC) adding +0.73%. The US dollar (UUP) traded in a broad range and ended up being the whipping boy again by dumping -0.83% to its lowest close since May last year. YTD, it’s now down over 10%.
- ETFs in the Spotlight (updated for 2017)
In case you missed the announcement and description of this section, you can read it here again.
It features 10 broadly diversified and sector ETFs from my HighVolume list as posted every Saturday. Furthermore, they are screened for the lowest MaxDD% number meaning they have been showing better resistance to temporary sell offs than all others over the past year.
The below table simply demonstrates the magnitude with which some of the ETFs are fluctuating in regards to their positions above or below their respective individual trend lines (%M/A). A break below, represented by a negative number, shows weakness, while a break above, represented by a positive percentage, shows strength.
For hundreds of ETF choices, be sure to reference Thursday’s StatSheet.
Year to date, here’s how the 2017 candidates have fared so far:
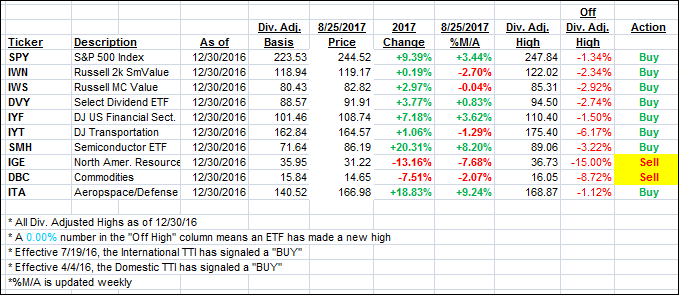
Again, the %M/A column above shows the position of the various ETFs in relation to their respective long term trend lines, while the trailing sell stops are being tracked in the “Off High” column. The “Action” column will signal a “Sell” once the -7.5% point has been taken out in the “Off High” column.
- Trend Tracking Indexes (TTIs)
Our Trend Tracking Indexes (TTIs) dipped slightly despite the major indexes eking out a gain.
Here’s how we closed 8/25/2017:
Domestic TTI: +2.20% (last close +2.31%)—Buy signal effective 4/4/2016
International TTI: +5.98% (last close +6.06%)—Buy signal effective 7/19/2016
Disclosure: I am obliged to inform you that I, as well as my advisory clients, own some of the ETFs listed in the above table. Furthermore, they do not represent a specific investment recommendation for you, they merely show which ETFs from the universe I track are falling within the guidelines specified.
————————————————————-
READER Q & A FOR THE WEEK
All Reader Q & A’s are listed at our web site!
Check it out at:
https://theetfbully.com/questions-answers/
———————————————————-
WOULD YOU LIKE TO HAVE YOUR INVESTMENTS PROFESSIONALLY MANAGED?
Do you have the time to follow our investment plans yourself? If you are a busy professional who would like to have his portfolio managed using our methodology, please contact me directly or get more details at:
https://theetfbully.com/personal-investment-management/
———————————————————
Back issues of the ETF/No Load Fund Tracker are available on the web at:
https://theetfbully.com/newsletter-archives/
Contact Ulli