Weekly StatSheet For The ETF Tracker Newsletter – Updated Through 09/28/2017

Ulli ETF StatSheet Contact

ETF Data updated through Thursday, September 28, 2017

Methodology/Use of this StatSheet:

  1. From the universe of over 1,800 ETFs, I have selected only those with a trading volume of over $5 million per day (HV ETFs), so that liquidity and a small bid/ask spread are assured.
  2. Trend Tracking Indexes (TTIs)

Buy or Sell decisions for Domestic and International ETFs (section 1 and 2), are made based on the respective TTI and its position either above or below its long-term M/A (Moving Average). A crossing of the trend line from below accompanied by some staying power above constitutes a “Buy” signal. Conversely, a clear break below the line constitutes a “Sell” signal. Additionally, I use a 7.5% trailing stop loss on all positions in these categories to control downside risk.

  1. All other investment arenas do not have a TTI and should be traded based on the position of the individual ETF relative to its own respective trend line (%M/A). That’s why those signals are referred to as a “Selective Buy.” In other words, if an ETF crosses its own trendline to the upside, a “Buy” signal is generated. Since these areas tend to be more volatile, I recommend a wider trailing sell stop of 7.5% -10% depending on your risk tolerance.

If you are unfamiliar with some of the terminology, please see Glossary of Terms and new subscriber information in section 9.


  1. DOMESTIC EQUITY ETFs: BUY — since 4/4/2016

Click on chart to enlarge

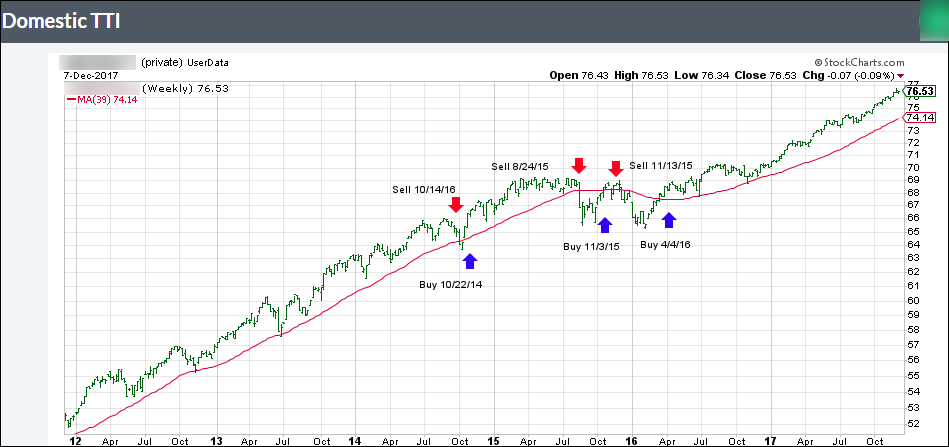
Our main directional indicator, the Domestic Trend Tracking Index (TTI-green line in the above chart) is positioned above its long-term trend line (red) by +2.78% after having generated a new Domestic Buy signal effective 4/4/2016 as posted.

Read More

Grinding Higher

Ulli Market Commentary Contact

[Chart courtesy of MarketWatch.com]
  1. Moving the Markets

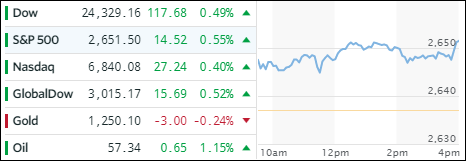
After an early slide, the major indexes managed to do a repeat pattern of what we’ve seen for the last year or so and that is to slowly crawl back to conquer the unchanged line. Today was no different, as worries about the complexity of the new tax code, concerns over deficits and the impact of special interest groups to derail the plan kept a lid on bullish euphoria and limited any advances. In the end, the trading range was tight with stocks, bonds and gold registering green numbers.

In regards to ETFs, we saw mainly positive numbers with the exception being Aerospace & Defense (ITA) showing a loss of -0.72% and Emerging Markets (SCHE) with -0.15%. On the plus side, International SmallCaps (SCHC) ruled with a gain of +0.68%, which was closely followed by Semiconductors (SMH) with +0.64%; a nice performance considering the Nasdaq ending flat.

The yield on the 10-year bond was unchanged at 2.31%, but that did not help the 20-year bond price (TLT). It slipped again, today by -0.30%, and has now surrendered 2/3 of its gains from its recent rally (August to early September).

After 3 days of advances, the US Dollar (UUP) pulled back -0.29% while spending the day in a tiny trading range.

Read More

Dow Snaps Losing Streak; Smallcaps Notch Record Close

Ulli Market Commentary Contact

[Chart courtesy of MarketWatch.com]
  1. Moving the Markets

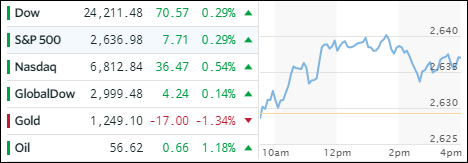
At least according to today’s performance, much confidence was given to Trump’s advertised sweeping tax reform, as the Russell 2000 notched not only a record close but also showed its biggest gain since the election. Strangely enough, the Fed’s Bullard came out and jawboned that “equity valuations may be stretched,” making me wonder if that is an admission that the stock market is in a bubble?

In regards to equity ETFs, we saw plenty of green. Leading the charge were Semiconductors (SMH), which surged +2.25% with SmallCaps (SCHA) taking second place with a solid gain of +1.57%. Ending up modestly in the red were Emerging Markets (SCHE) with -0.45%.

When there are winners, there must be losers. Bond yields rose sharply with the 10-year gaining 7 basis points to 2.31%. This is in striking distance of its 200-day M/A (2.33%). Any break above could indicate that the 2 month bond rally (lower rates) has run its course, and we’re back to an environment of higher yields. As a consequence, the 20-year bond price (TLT) gapped lower and lost -1.51%.

The threat of higher yields powered the US Dollar index (UUP) off its early September lows and above its 50-day M/A. On a daily chart, it still looks like a dead cat bounce, but continuously rising rates could certainly breathe new life into the for dead declared dollar—at least for the time being.

Read More

No Market Report

Ulli Uncategorized Contact

Due to my continued travels, there will be no market report today. Regular posting will resume tomorrow afternoon.

Summer Blues

Ulli Market Commentary Contact

[Chart courtesy of MarketWatch.com]
  1. Moving the Markets

Due to a 2-day business trip, the next 2 market reports will be short and sweet.

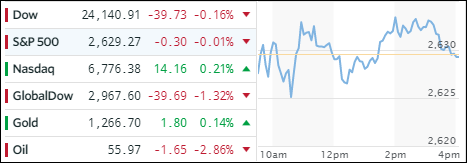
The major indexes slipped and spent the entire session below their respective unchanged lines, but saving the day were SmallCaps and Transports scoring small gains, but gains nonetheless. For the month the Transportation index is up some 4%.

Interest rates dropped, along with the Nasdaq but gold rallied as saber rattling with N. Korea accelerated again. The US Dollar jumped and is honing in on its 50-day M/A.

  1. ETFs in the Spotlight (updated for 2017)

In case you missed the announcement and description of this section, you can read it here again.

It features 10 broadly diversified and sector ETFs from my HighVolume list as posted every Saturday. Furthermore, they are screened for the lowest MaxDD% number meaning they have been showing better resistance to temporary sell offs than all others over the past year.

The below table simply demonstrates the magnitude with which some of the ETFs are fluctuating in regards to their positions above or below their respective individual trend lines (%M/A). A break below, represented by a negative number, shows weakness, while a break above, represented by a positive percentage, shows strength.

For hundreds of ETF choices, be sure to reference Thursday’s StatSheet.

Year to date, here’s how the 2017 candidates have fared so far:

Again, the %M/A column above shows the position of the various ETFs in relation to their respective long term trend lines, while the trailing sell stops are being tracked in the “Off High” column. The “Action” column will signal a “Sell” once the -7.5% point has been taken out in the “Off High” column.

  1. Trend Tracking Indexes (TTIs)

Our Trend Tracking Indexes (TTIs) retreated as today’s overall tone was bearish.

Here’s how we closed 9/25/2017:

Domestic TTI: +2.39% (last close +2.56%)—Buy signal effective 4/4/2016

International TTI: +6.45% (last close +6.91%)—Buy signal effective 7/19/2016

Disclosure: I am obliged to inform you that I, as well as my advisory clients, own some of the ETFs listed in the above table. Furthermore, they do not represent a specific investment recommendation for you, they merely show which ETFs from the universe I track are falling within the guidelines specified.

One Man’s Opinion: Today The Music Stops

Ulli Market Review Contact

By Simon Black

Today’s the day.

After months of preparing financial markets for this news, the Federal Reserve is widely expected to announce that it will finally begin shrinking its $4.5 trillion balance sheet.

I know, that probably sound reeeeally boring. A bunch of central bankers talking about their balance sheet.

But it’s phenomenally important. And I’ll explain why-

When the Global Financial Crisis started in 2008, the Federal Reserve (along with just about every central bank in the world) took the unprecedented step of conjuring trillions of dollars out of thin air.

In the Fed’s case, it was roughly $3.5 trillion, about 25% of the size of the entire US economy at the time.

That’s a lot of money.

And after nearly a decade of this free money policy, there is more money in the financial system than ever before.

Read More