- Moving the Markets
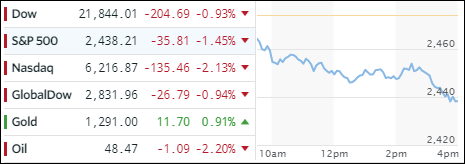
The war drums with N. Korea were beating louder today as the high octane rhetoric was turned up a notch with a “preemptive strike” headline and similar dialogues pulling stocks down for the 3rd consecutive day. The session ended with the major indexes at their lows, which will make for an interesting opening tomorrow. If you find the news confusing, you might want to read a right-to-the-point article from the Ron Paul Institute here.
ZH summed the day up best:
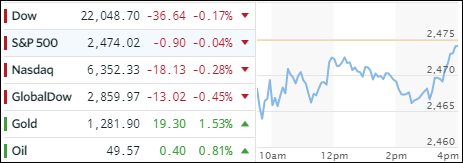
- Nasdaq, Dow, S&P, Small Caps worst day in 3 months (to one month lows)
- S&P Tech Sector worst day in 2 months
- Financials worst day in 3 months
- HYG (HY Bond) worst 3-day move in 5 months (to lowest since March)
- VIX biggest 3-day spike since Aug 2015 China devaluation
- Gold’s best 3-day rally in 3 months
- Yuan biggest 3-day gain in 2 months
Of course, should this war mongering talk end up being a nothing burger, we could see a gigantic rally back towards record territory, but it’s too early to tell. For the time being, volatility shot up with the S&P VIX banging through its 200 day M/A and closing at 16, which is quite a jump from its recent low of around 8 and is its highest price since the election.
To no surprise, gold had another good day and surged to a 2-month high. This level of uncertainly had Wall Street traders move into bonds causing interest rates to drop thereby allowing the 20-year bond TLT to rally +0.85%. The US Dollar (UUP) held up fairly well and gave back only a modest -0.17%. Please see section 3 below as to the affect on our Trend Tracking Indexes (TTIs).