ETF Tracker Newsletter For May 16, 2025

Ulli ETF Tracker Contact

ETF Tracker StatSheet          

You can view the latest version here.

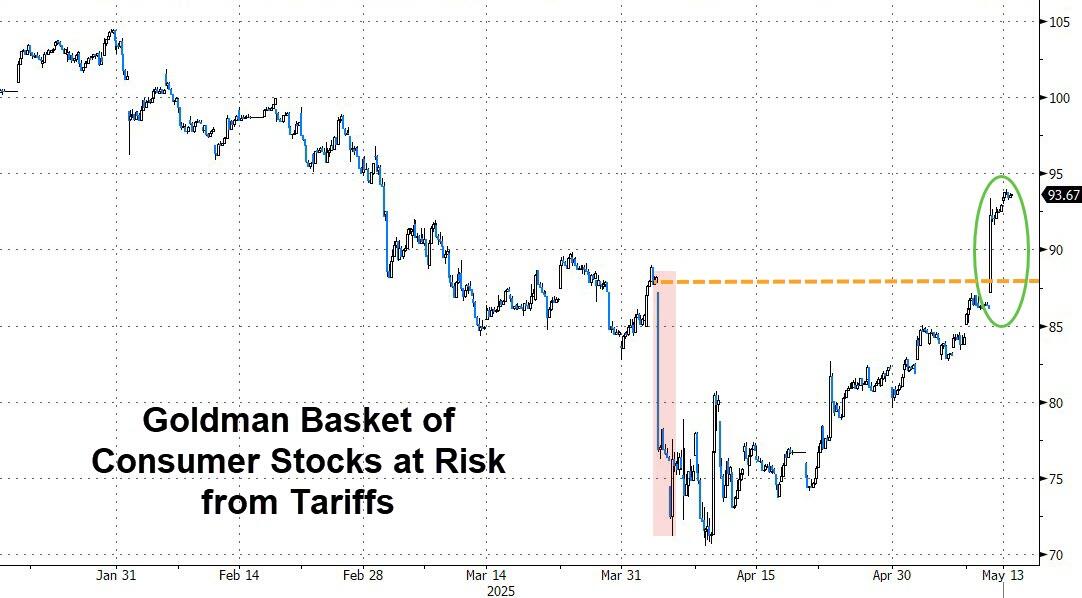
TARIFF TRUCE AND SOFT INFLATION DATA SPARK MARKET REBOUND DESPITE CAUTION

[Chart courtesy of MarketWatch.com]

  1. Moving the market

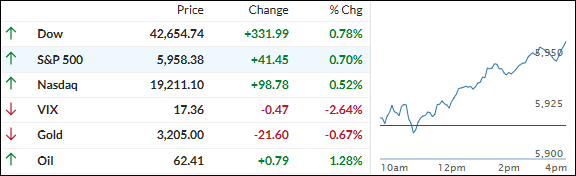
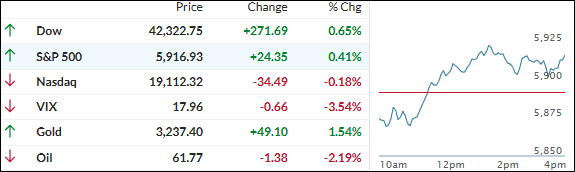
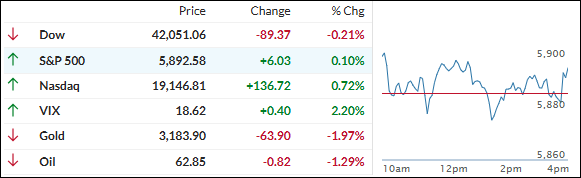
The markets began the day on a cautious note, with a disappointing consumer sentiment report halting the S&P 500’s four-day rally-a run that had been fueled by a temporary U.S./China tariff agreement and encouraging inflation data.

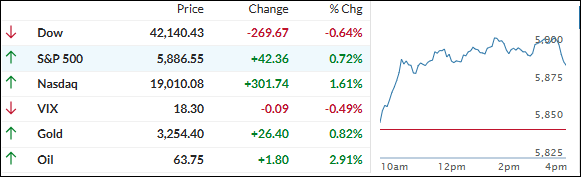
Despite the initial pause, the major indexes regained strength as the session progressed, buoyed by renewed optimism over global trade policy and softer-than-expected inflation figures.

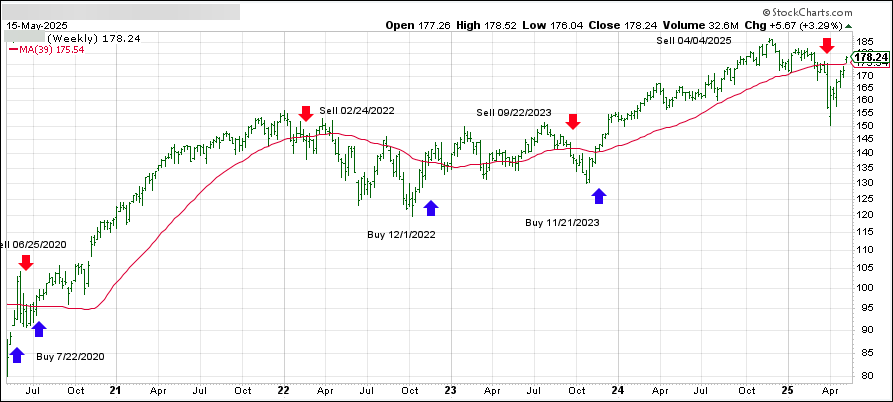
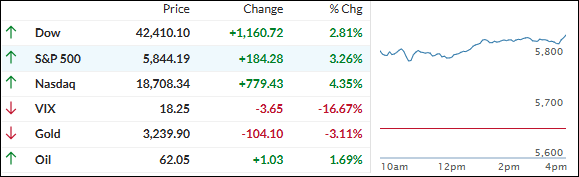
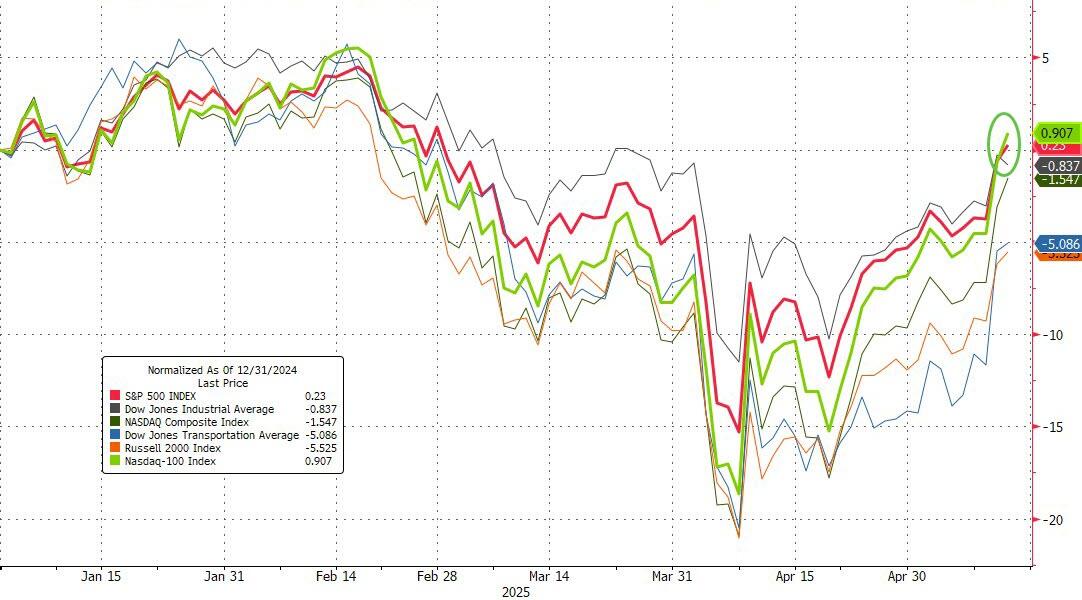
The S&P 500 has rebounded sharply since the announcement of the 90-day tariff truce, now breaking above its widely watched 200-day moving average-a technical milestone often interpreted as a bullish signal.

Our domestic TTI has mirrored this upward momentum, and unless there is a sudden reversal, I anticipate re-entering domestic equities by next week.

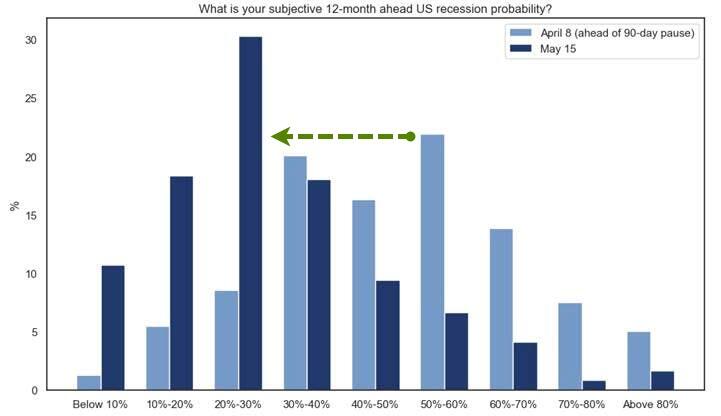
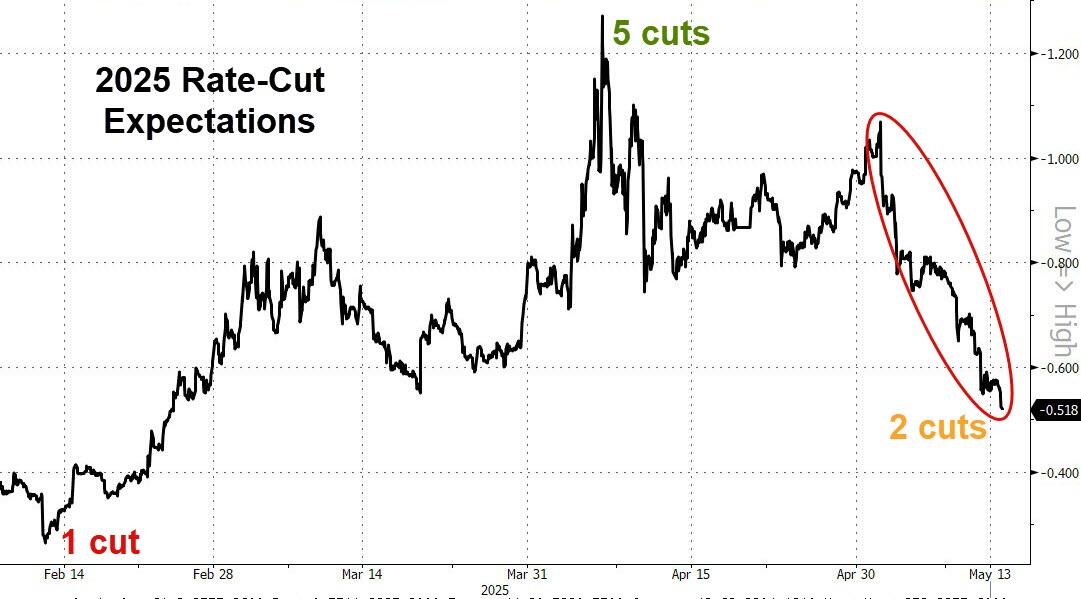
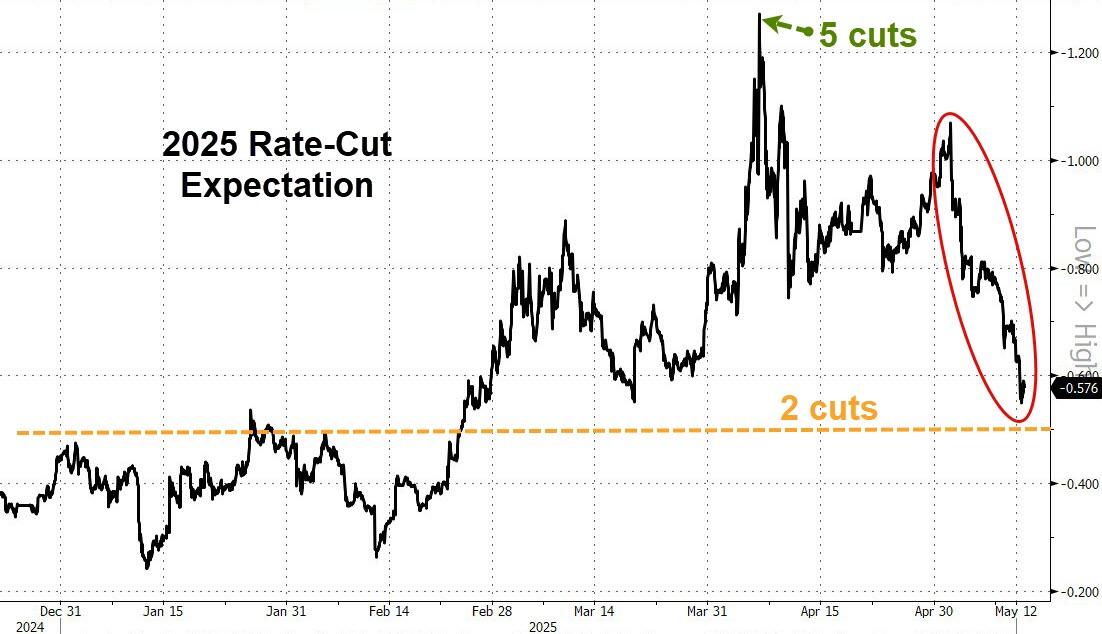
However, consumer sentiment weighed on traders’ enthusiasm early in the session. The latest reading fell to 50.8 in May from 52.2 in April, while inflation expectations for the coming year surged to 7.3% from 6.5%, reflecting growing concerns about the impact of Trump’s tariff policies.

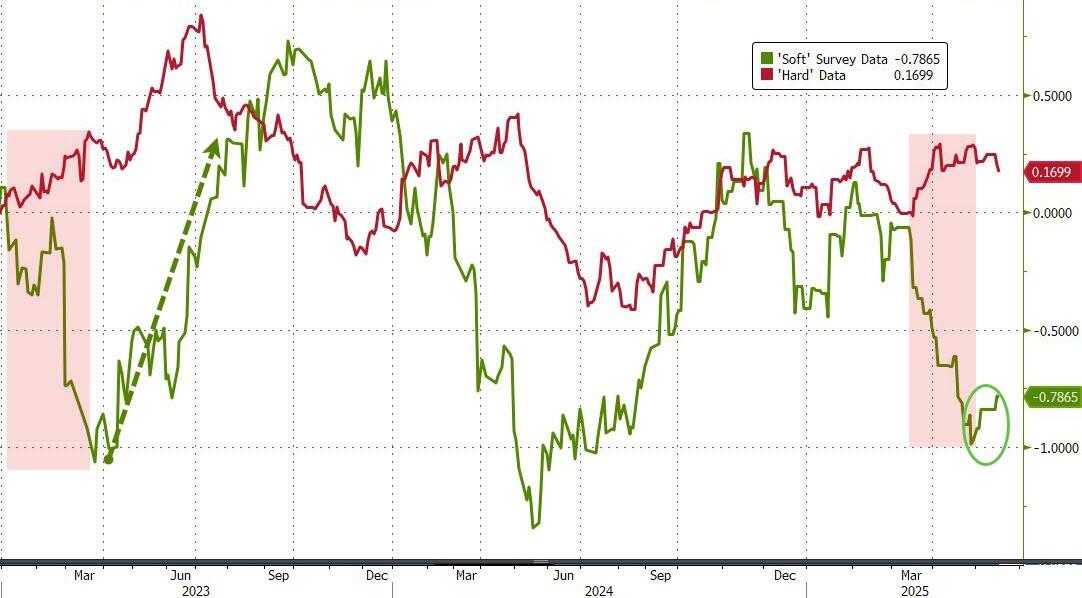
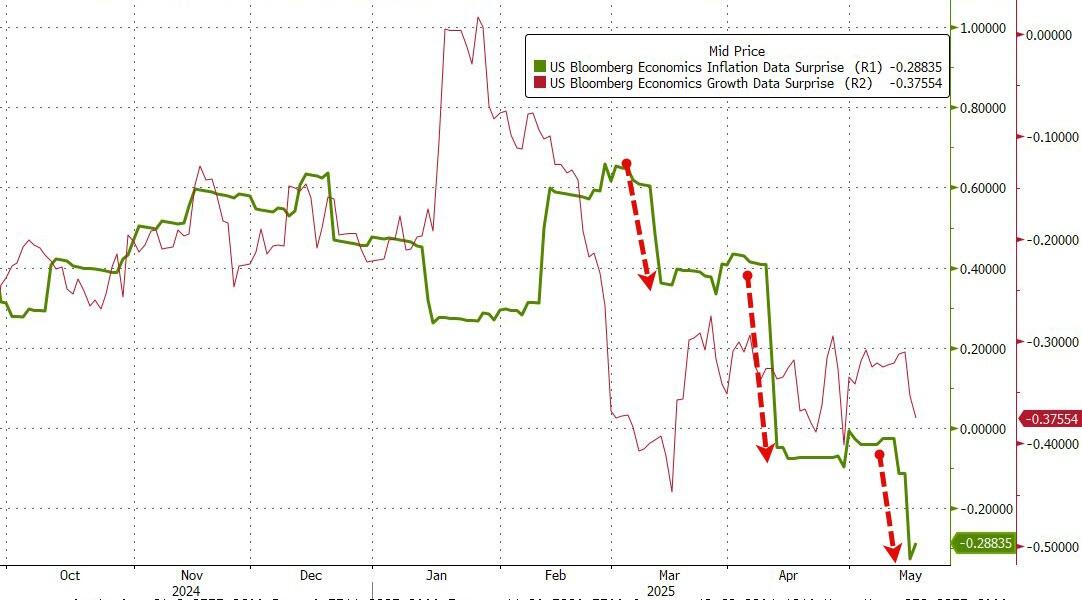
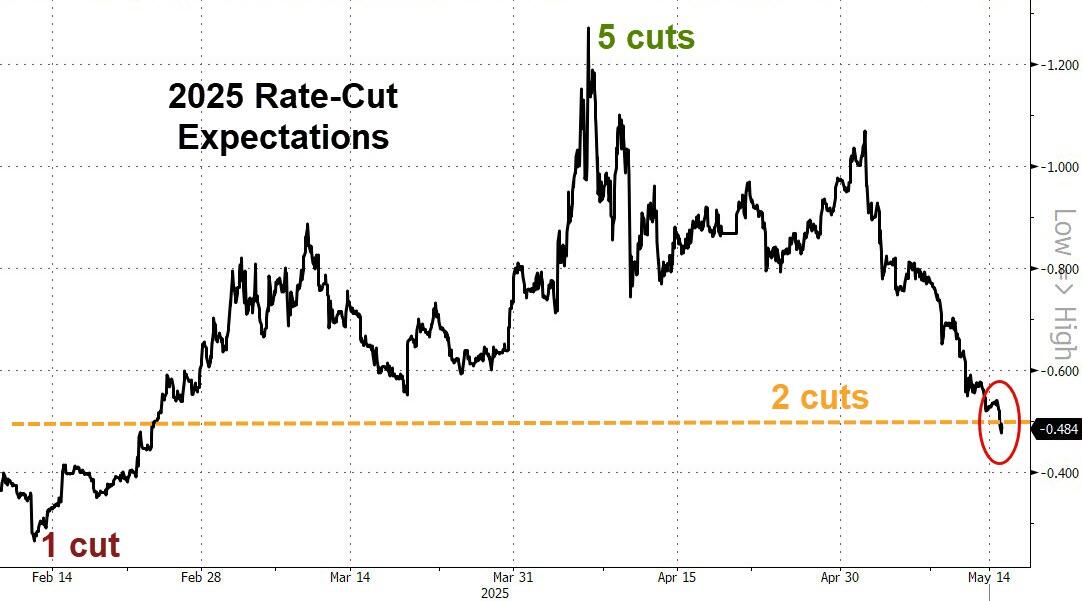
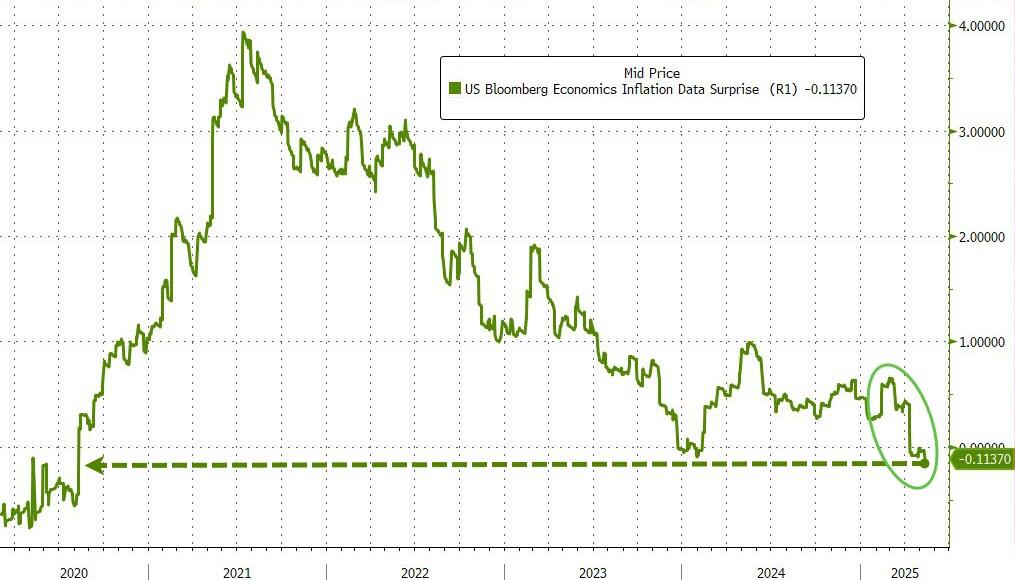
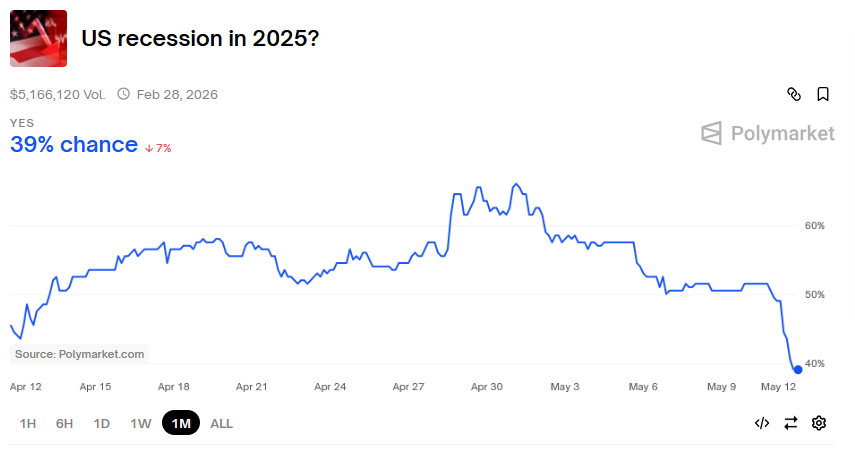
As the day unfolded, uncertainty over global trade policy eased and “soft” economic data improved, helping the major indexes stabilize and allowing bullish sentiment to return. Notably, inflation-related macroeconomic data continued to surprise to the downside, as highlighted by ZeroHedge.

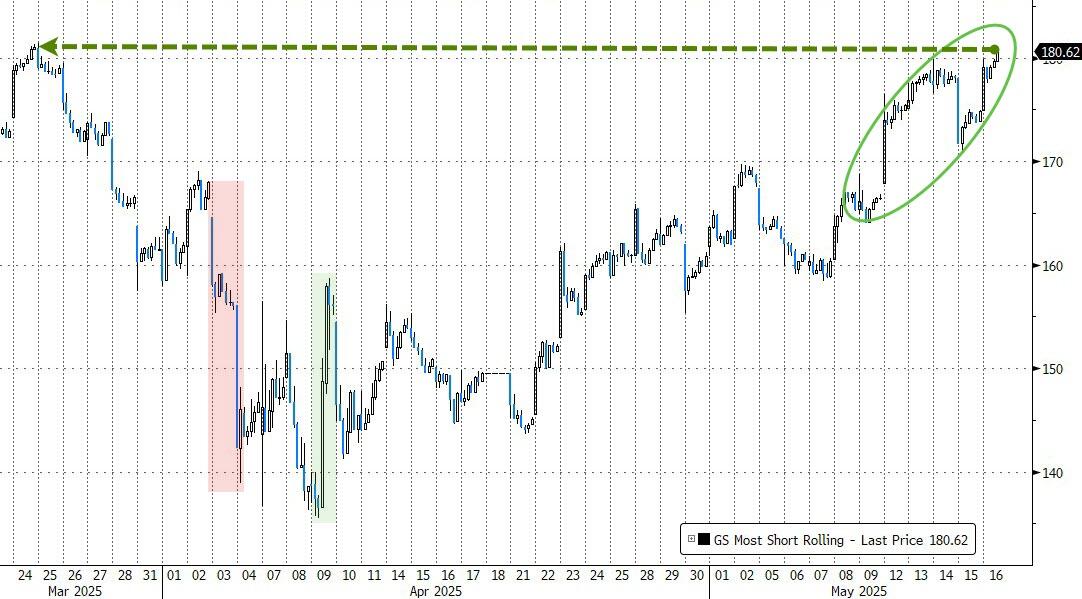
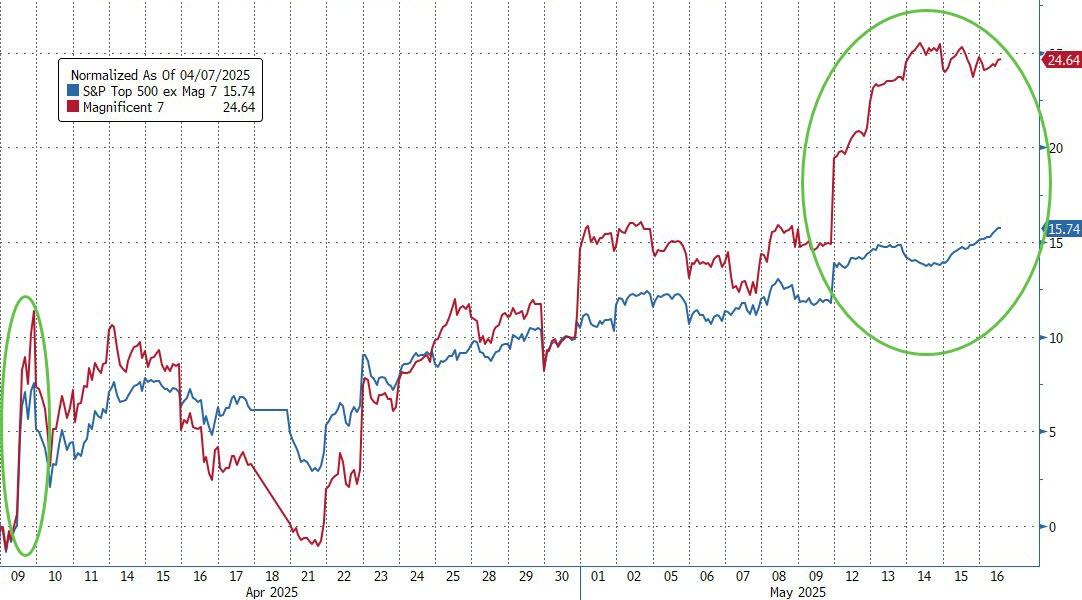
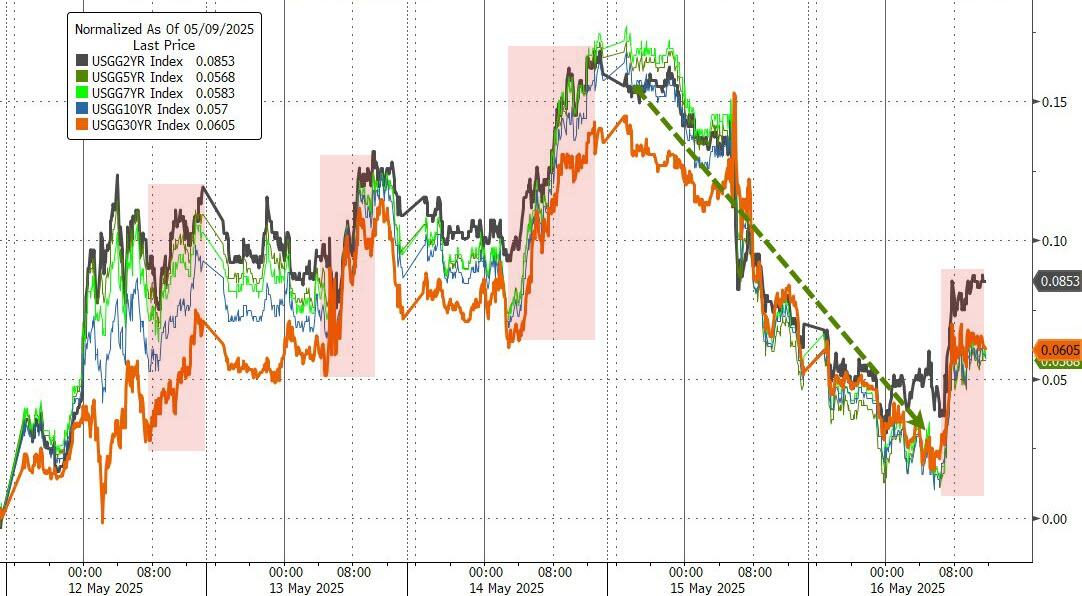
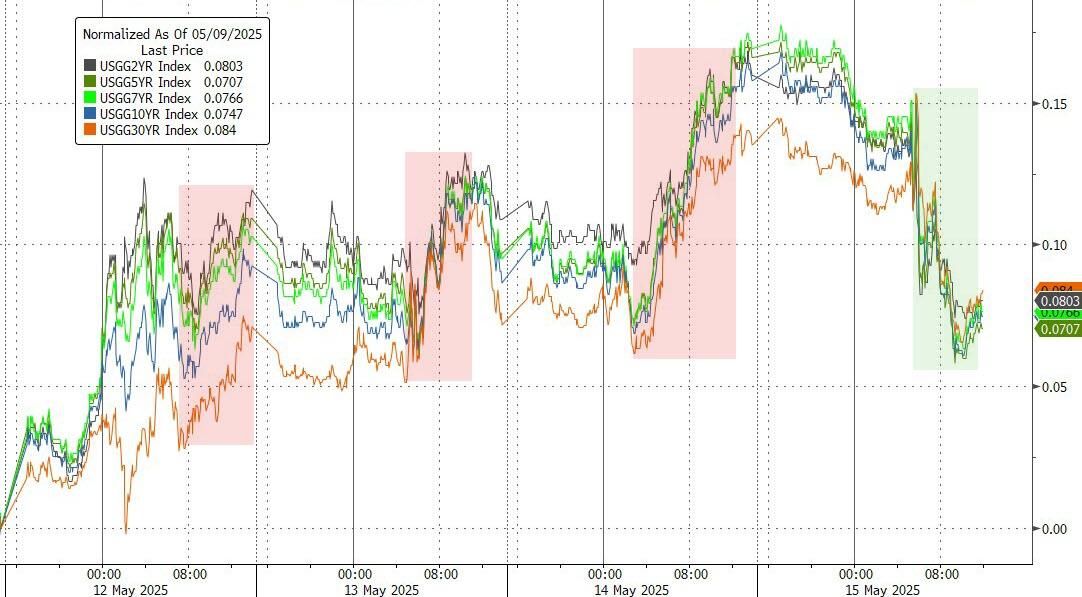
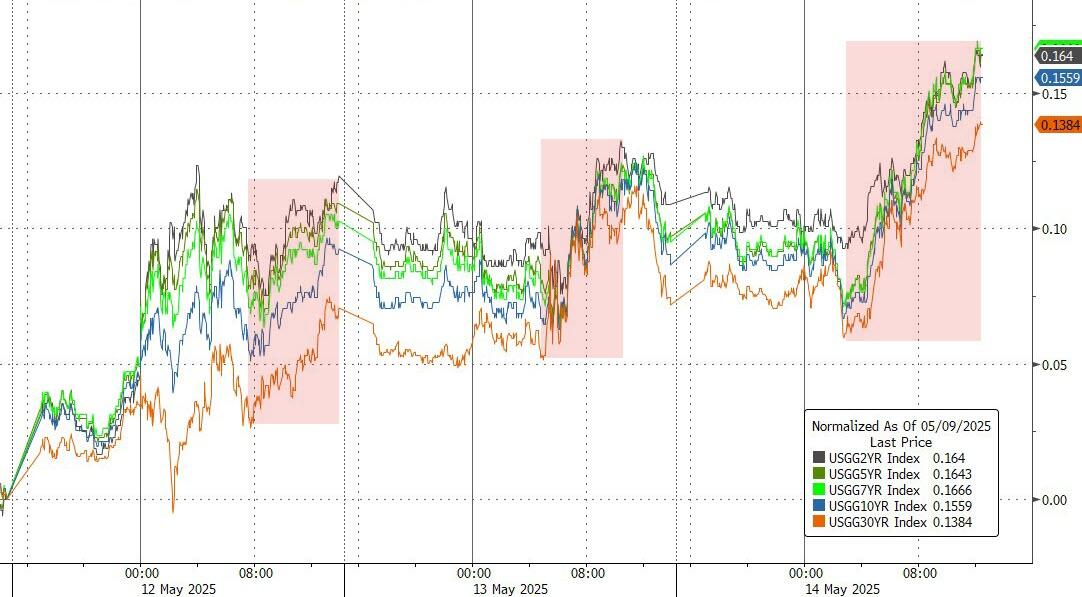
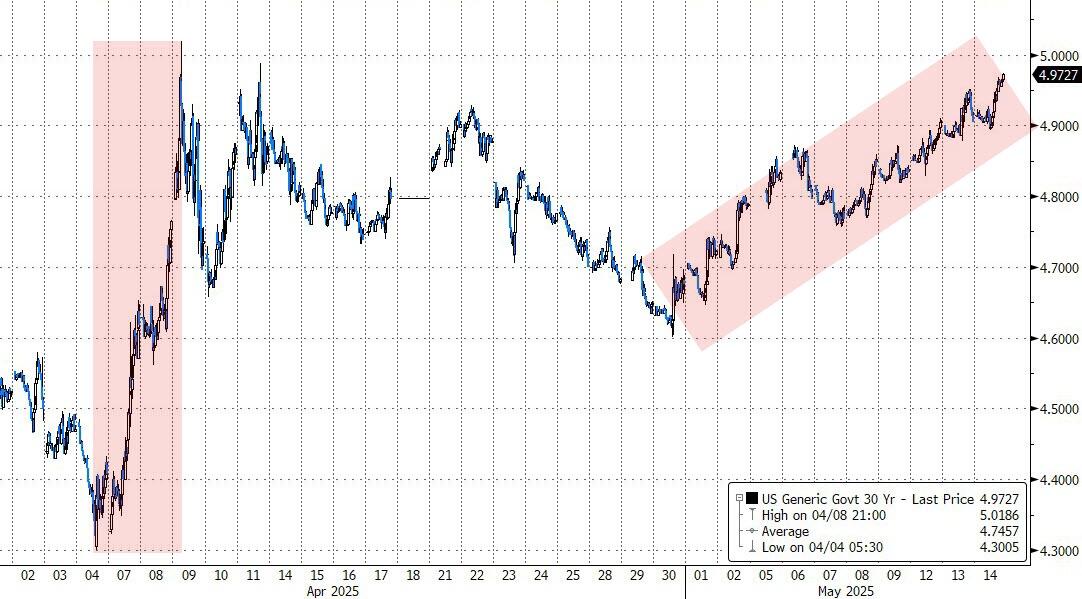
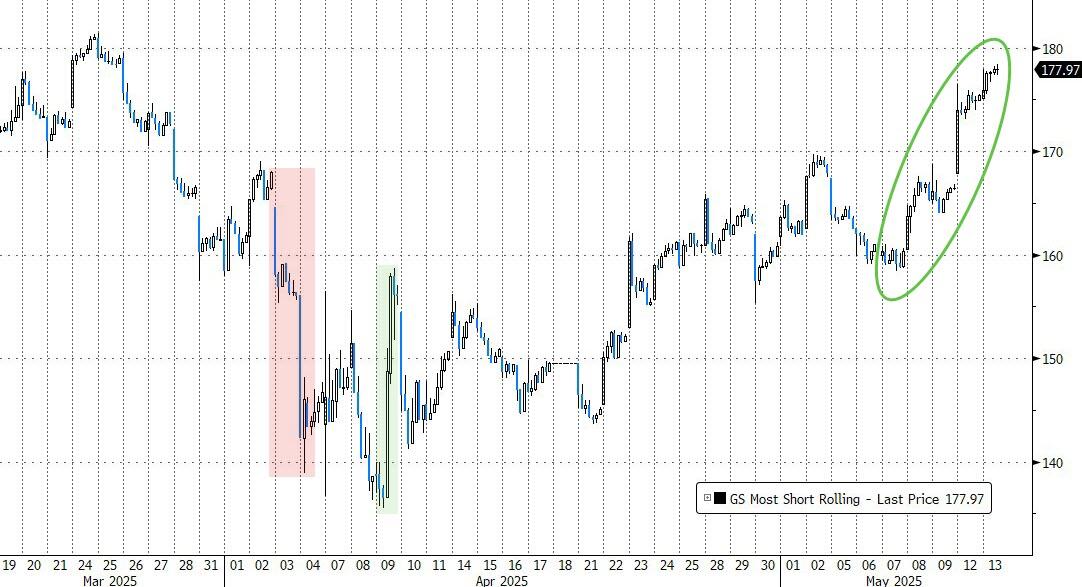
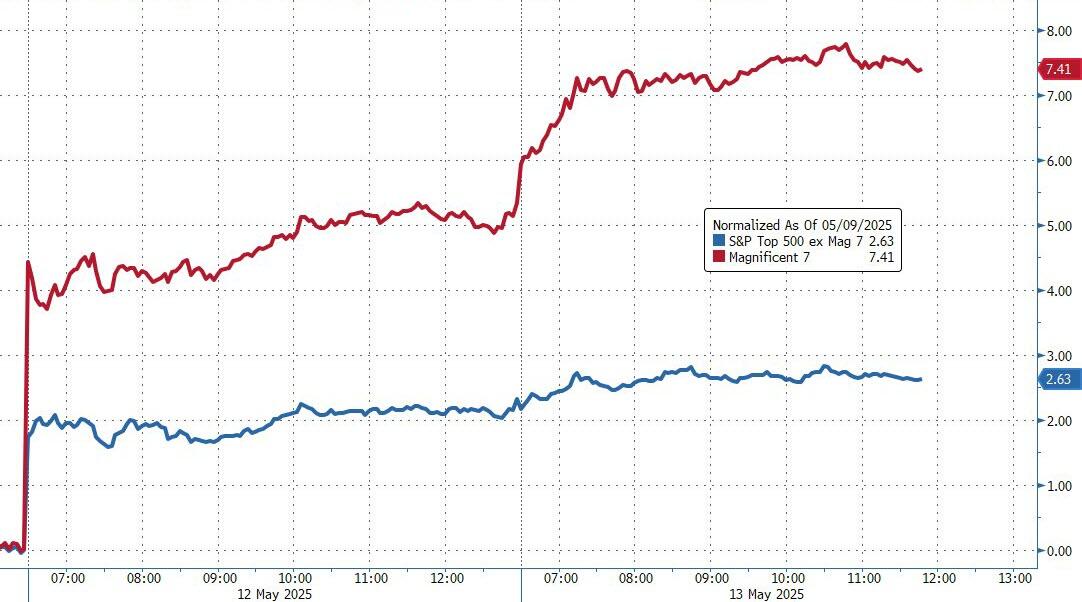
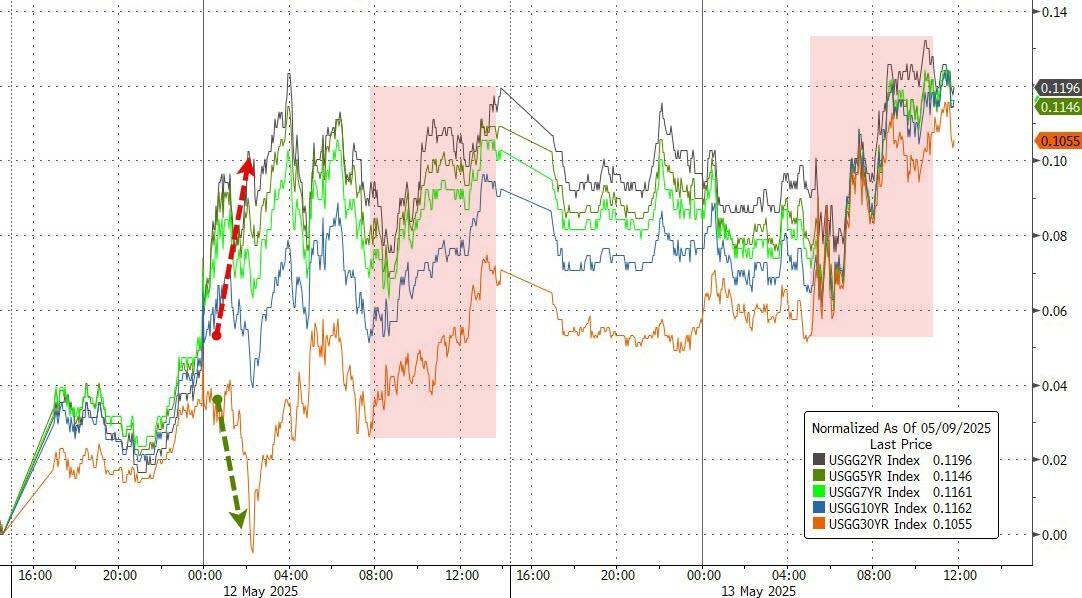
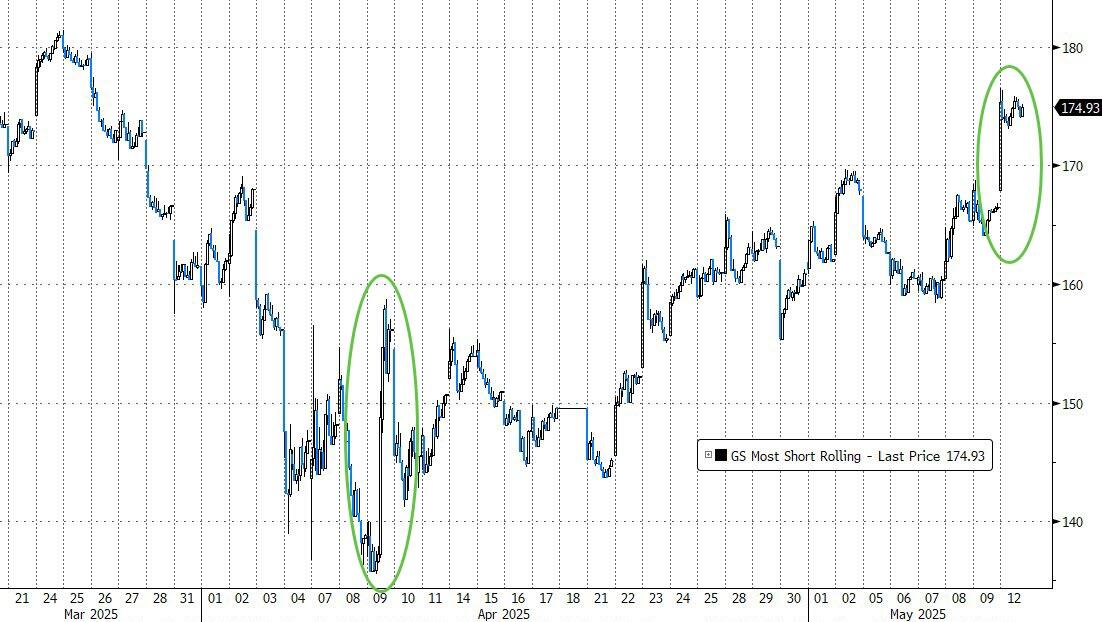
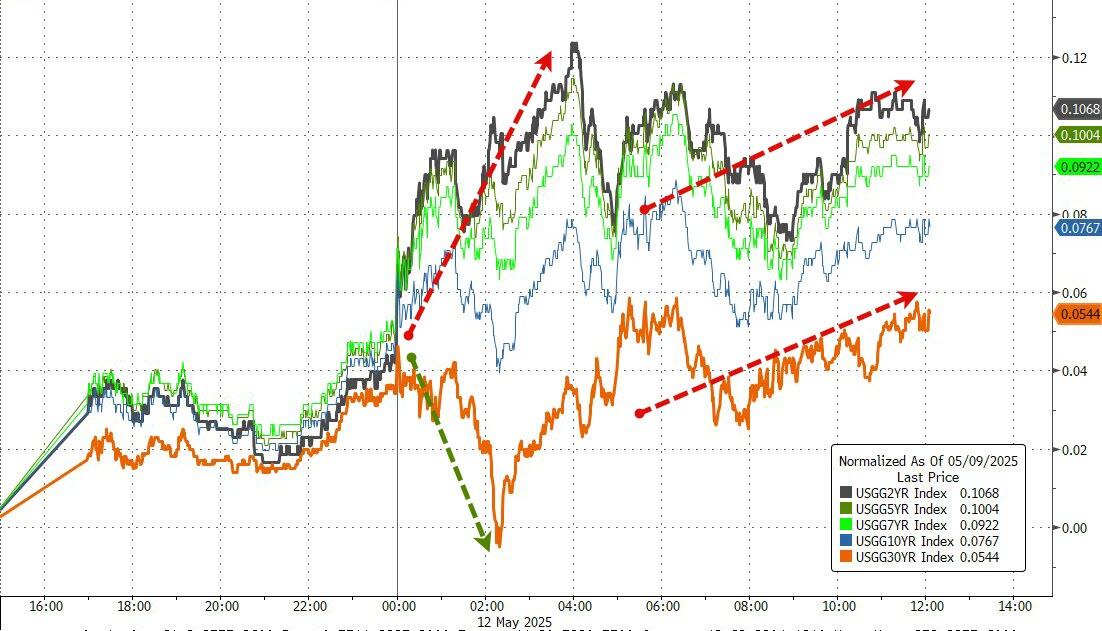
This week also saw the largest short squeeze since last Thanksgiving, driving the Mag7 basket to continue its impressive rebound. Bond yields climbed for the third consecutive week, yet this rise did not negatively impact equities—a divergence from typical market behavior.

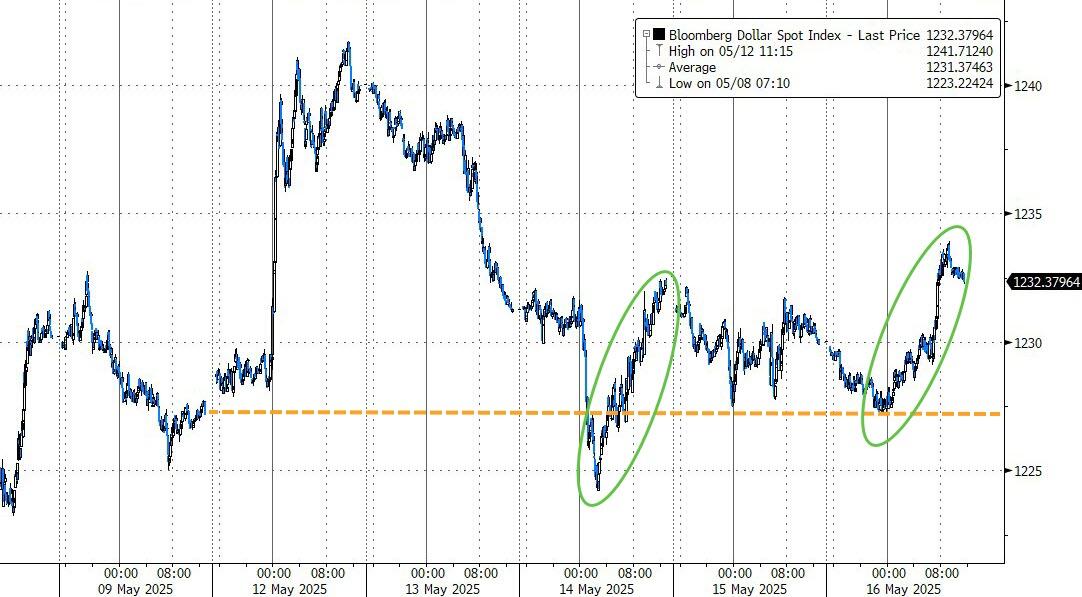
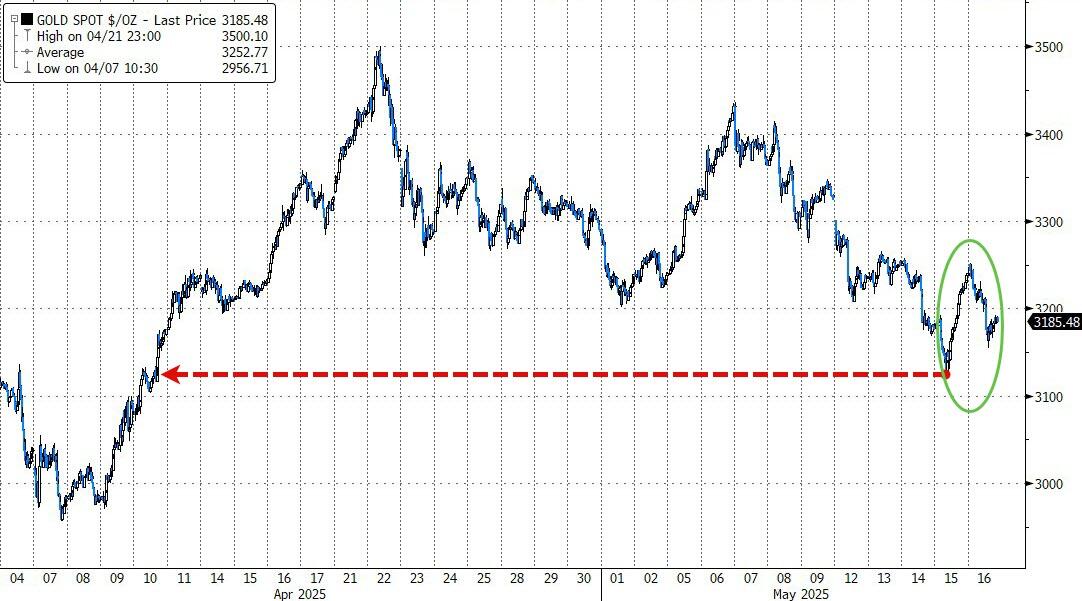
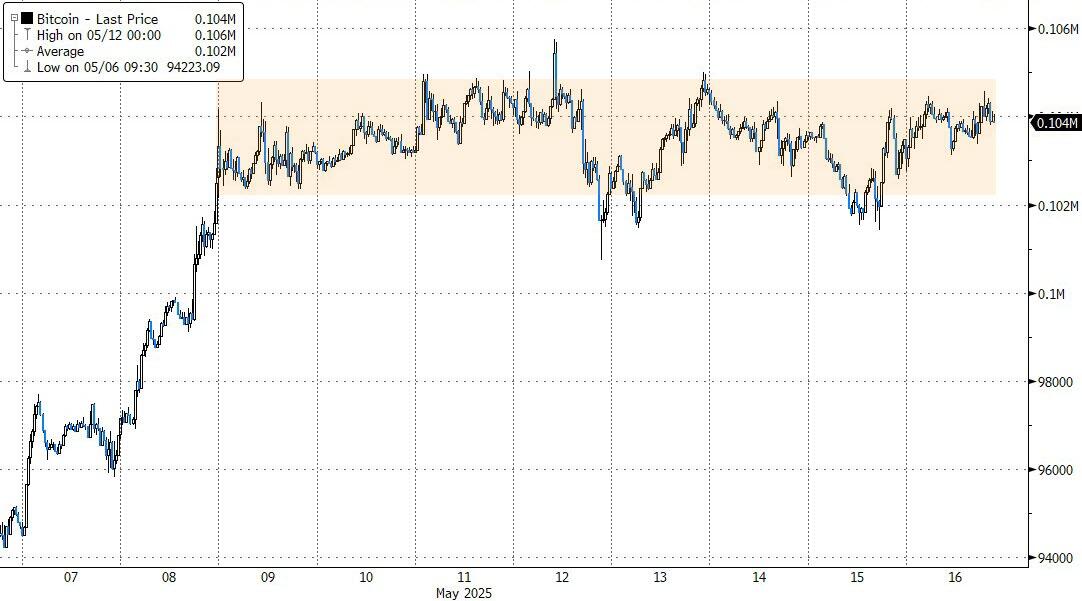
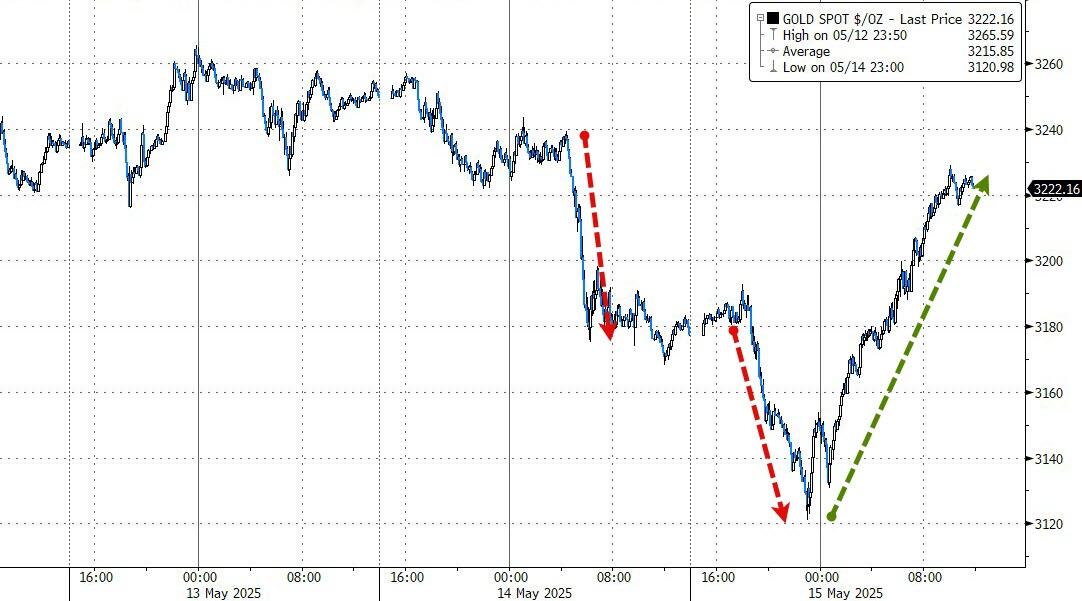
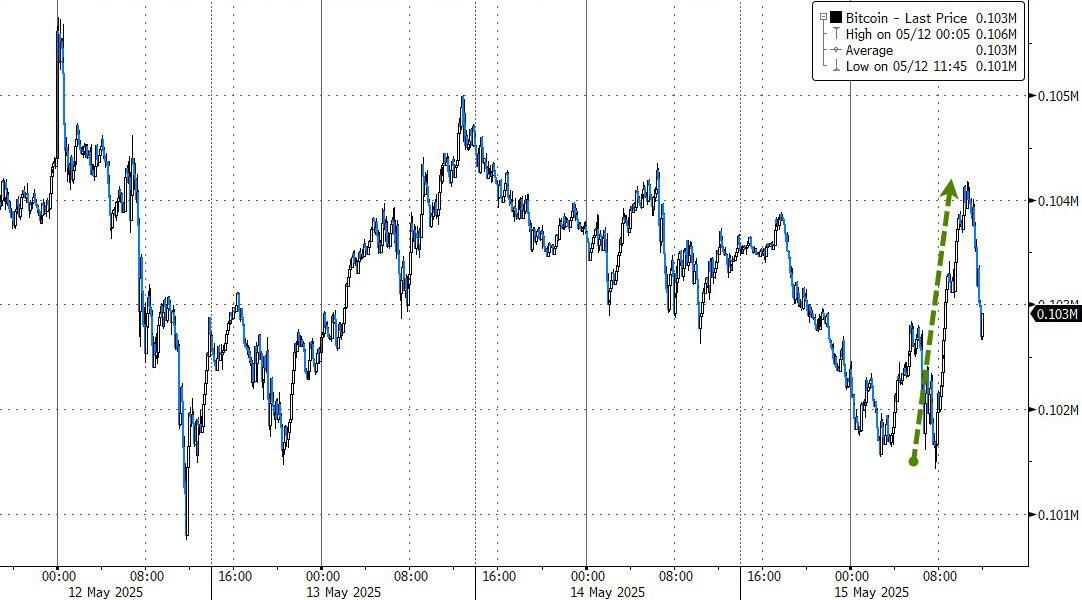
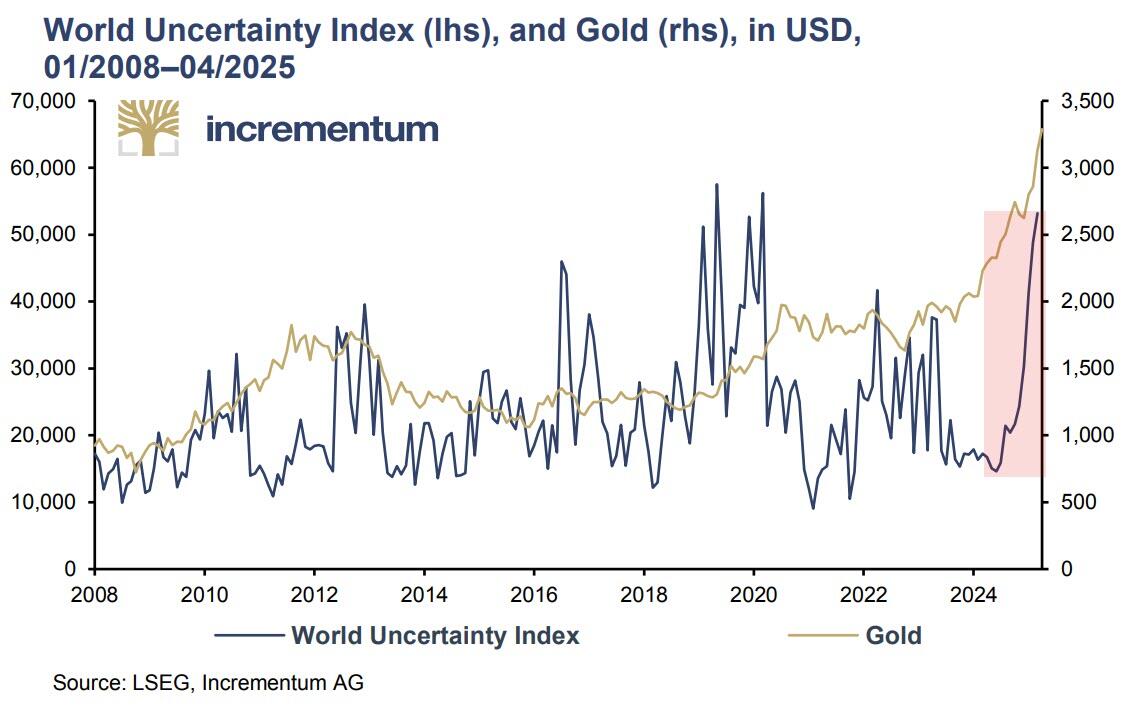
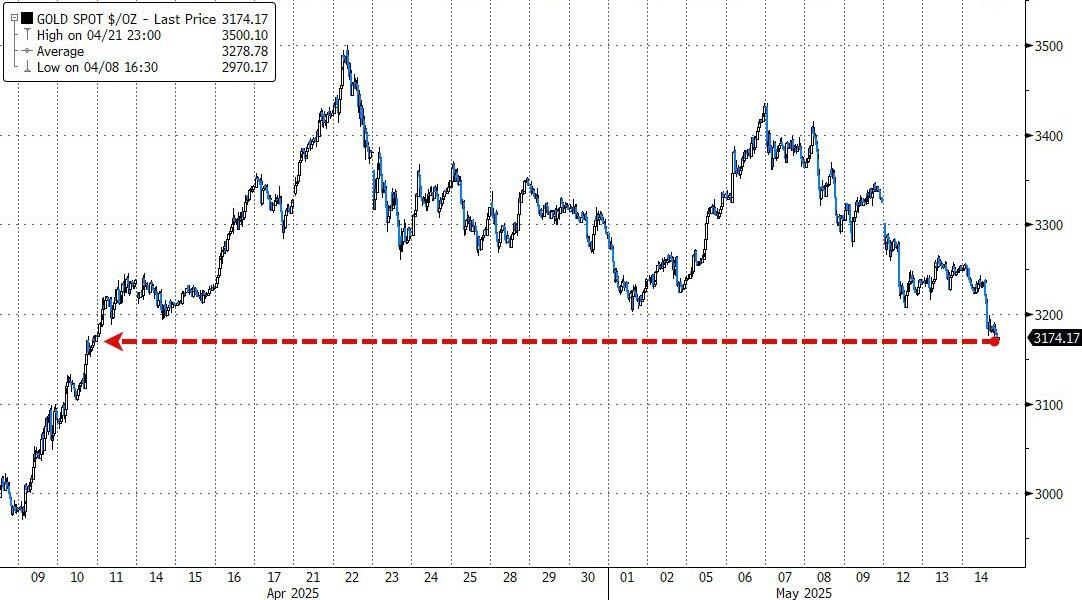
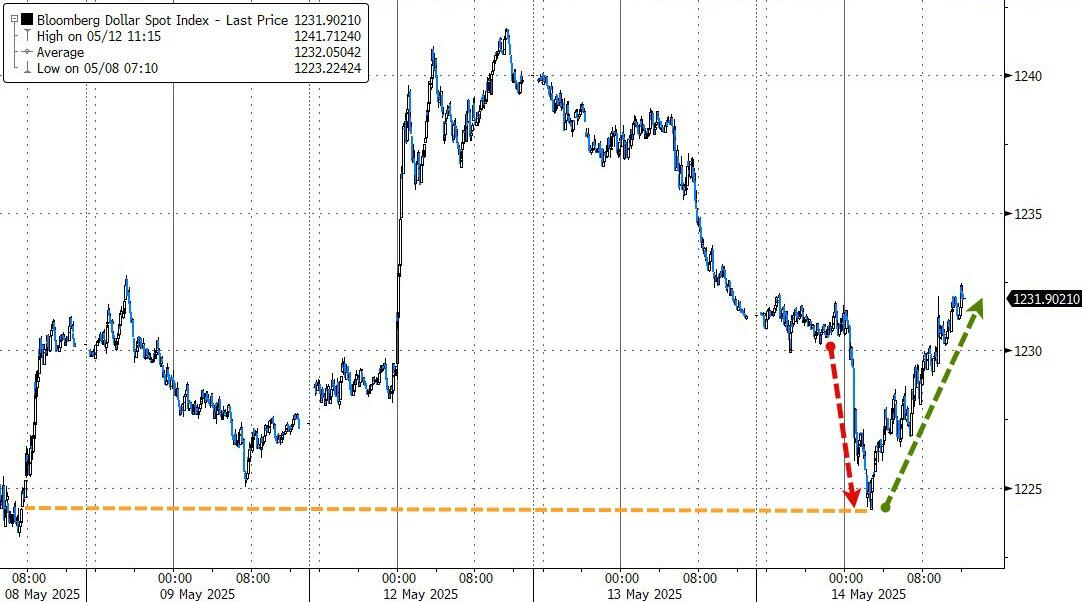
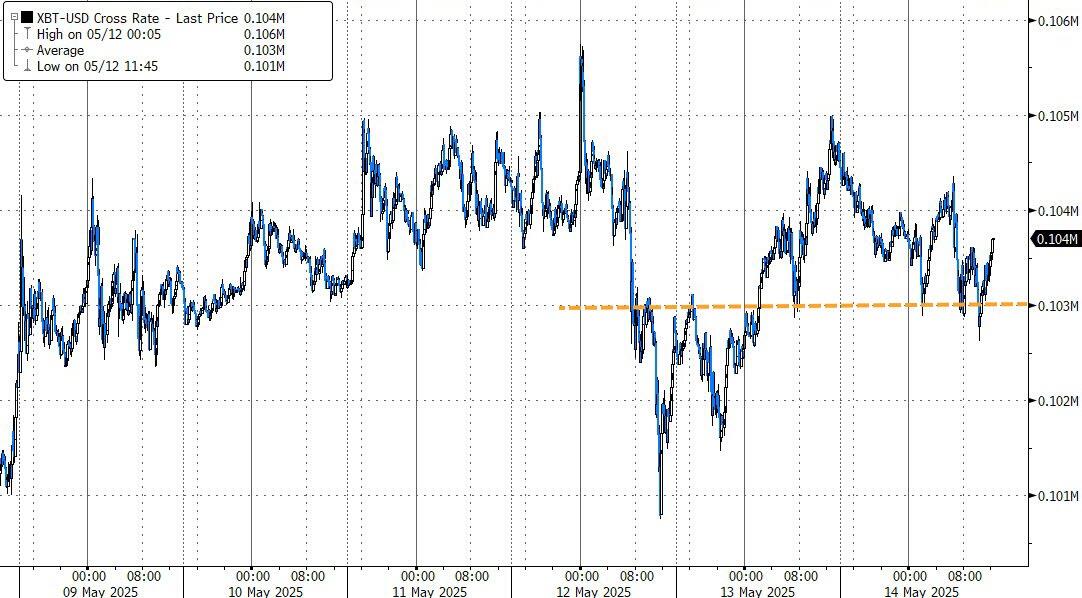
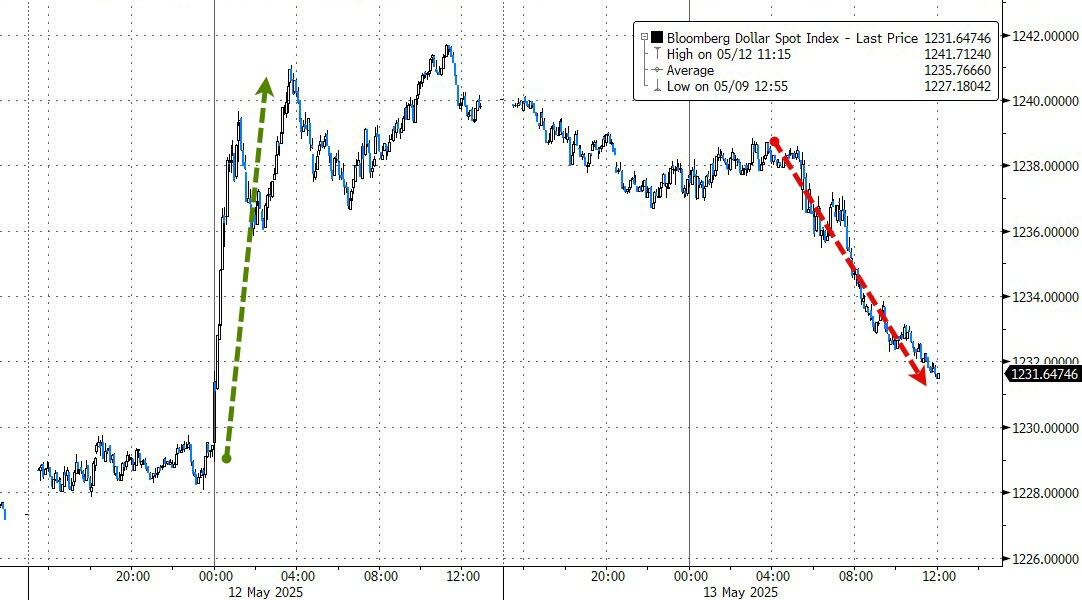
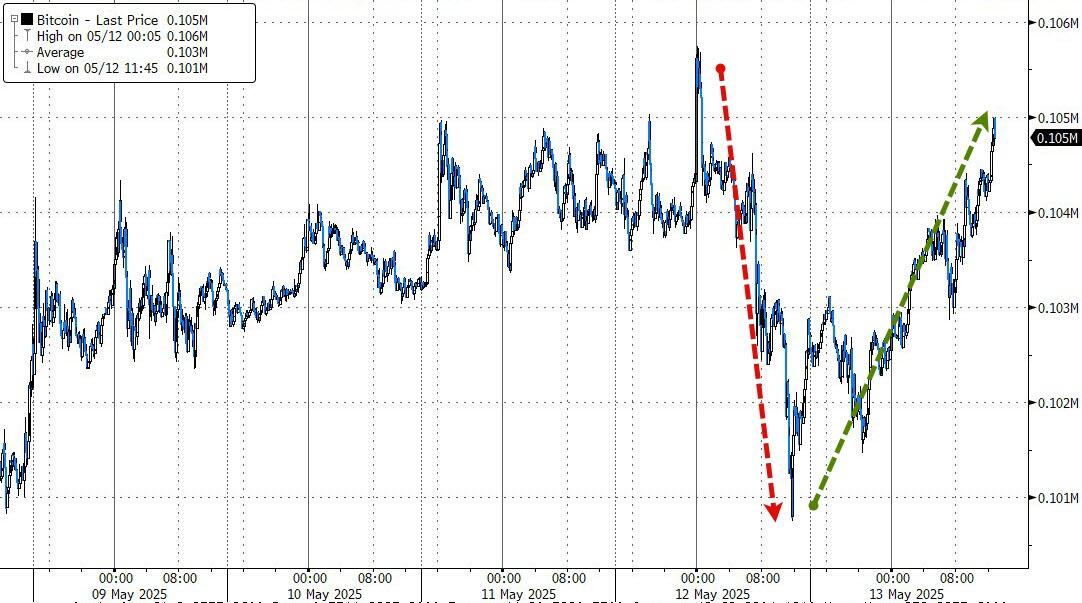
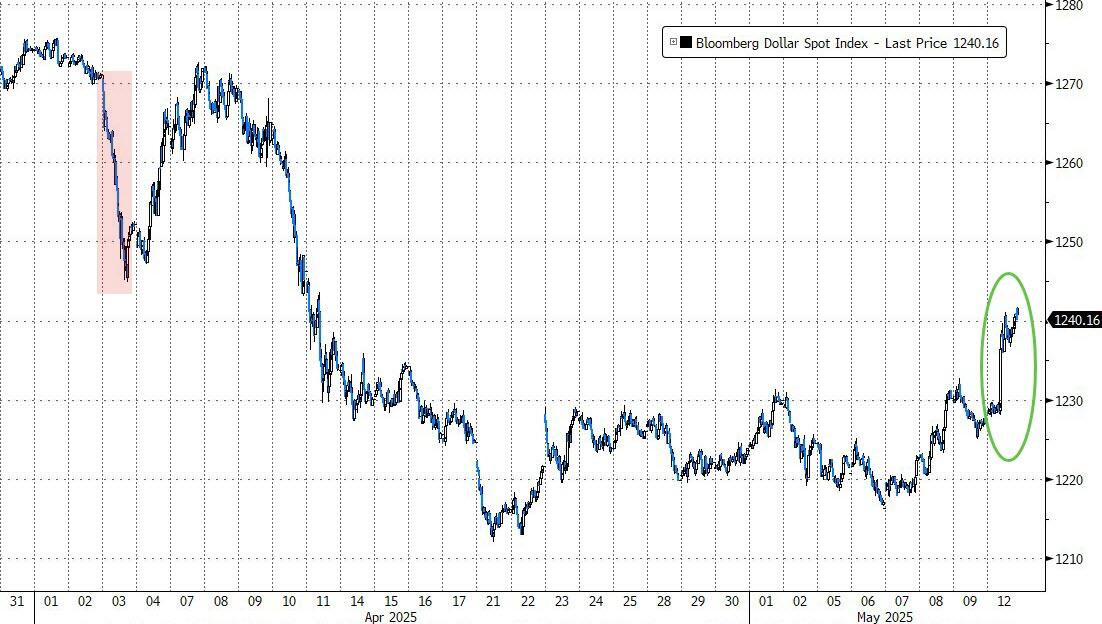
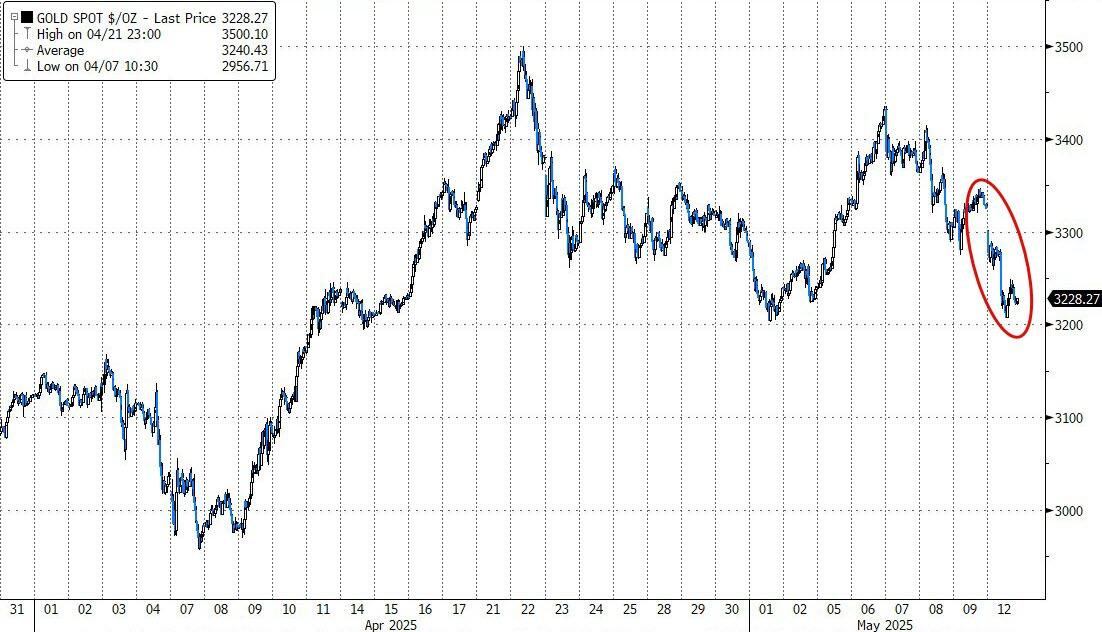
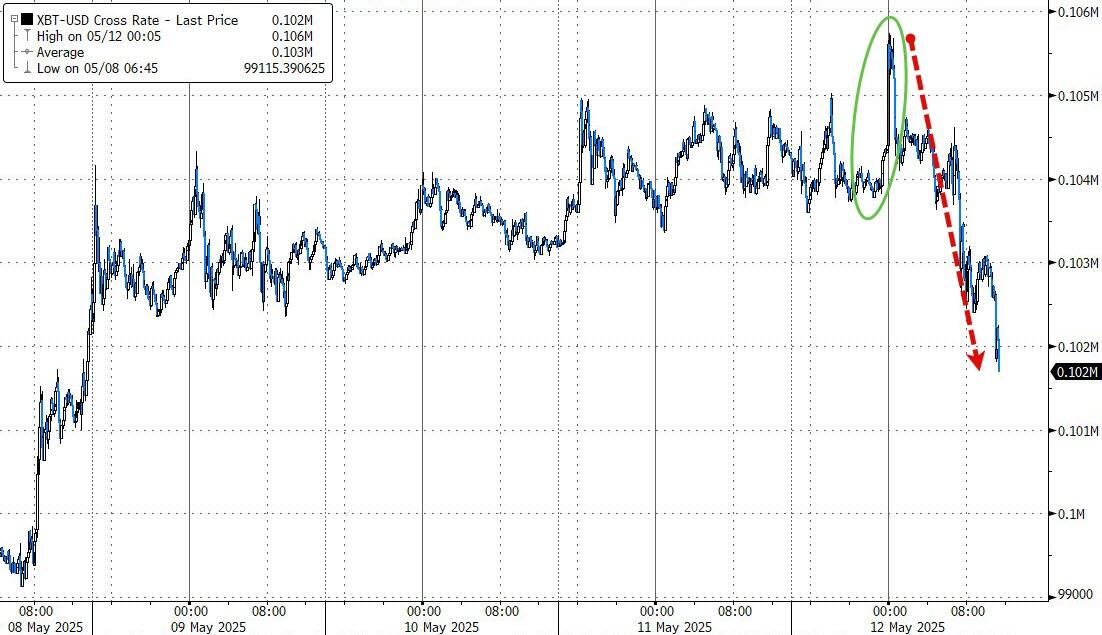
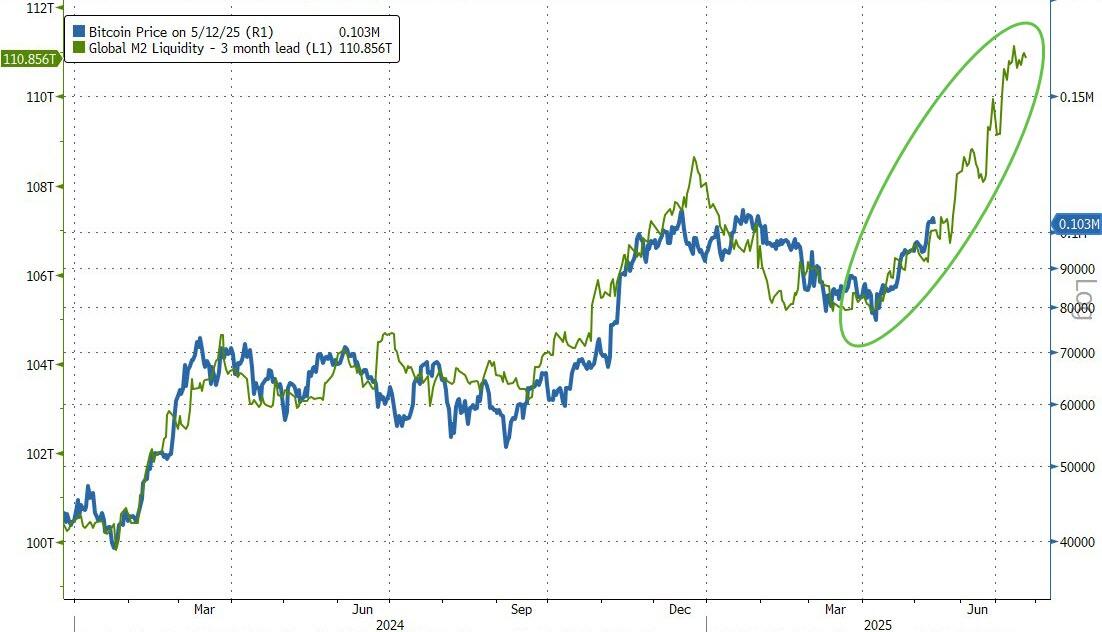
Meanwhile, the dollar strengthened for a second week, pressuring gold prices lower as some market uncertainties subsided. Bitcoin, after five weeks of gains, ended the week unchanged.

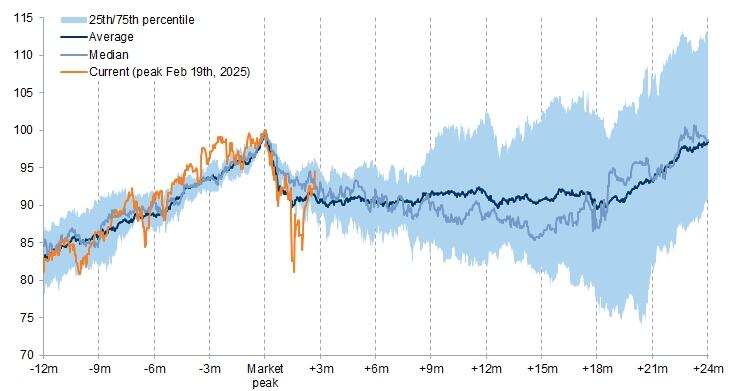
It’s worth noting that equities have just experienced one of the sharpest drawdowns in the past 75 years but have managed a swift recovery. Still, historical patterns suggest that the path for further gains may be challenging from here.

Regardless, we will continue to follow our TTIs, with a new “Buy” signal likely to be confirmed on Monday.

Still, the question remains: With markets at a crossroads, will the recent rebound prove sustainable, or will historical trends reassert themselves and cap further gains?

Read More

Weekly StatSheet For The ETF Tracker Newsletter – Updated Through 05/15/2025

Ulli ETF StatSheet Contact

ETF Data updated through Thursday, May 15, 2025

How to use this StatSheet:

  1. Out of the 1,800+ ETFs out there, I only pick the ones that trade over $5 million per day (HV ETFs), so you don’t get stuck with a lemon that nobody wants to buy or sell.
  1. Trend Tracking Indexes (TTIs)

These are the main indicators that tell you when to buy or sell Domestic and International ETFs (section 1 and 2). They do that by comparing their position to their long-term M/A (Moving Average). If they cross above, and stay there, it’s a green light to buy. If they fall below, and keep going, it’s a red light to sell. And to make sure you don’t lose your shirt if things go south, I also use a 12% trailing stop loss on all positions in these categories.

  1. All other investment areas don’t have a TTI and should be traded based on the position of each ETF relative to its own trend line (%M/A). That’s why I call them “Selective Buy.” In other words, if an ETF goes above its own trend line, you can buy it. But don’t forget to use a trailing sell stop of 12%, or less if you’re feeling nervous.

If some of these words sound like Greek to you, please check out the Glossary of Terms and new subscriber information in section 9.

  1. DOMESTIC EQUITY ETFs: SELL— effective 4/4/2025

Click on chart to enlarge

This is our main compass, the Domestic Trend Tracking Index (TTI-green line in the above chart). It has now broken above its long-term trend line (red) by +1.68% but remains in “Sell” mode until we get more upside follow through.

Read More

Markets Mixed As Tech Lags And Uncertainty Looms

Ulli Market Commentary Contact

[Chart courtesy of MarketWatch.com]

  1. Moving the market

Equities opened lower as early optimism faded, with all three major indexes dipping into negative territory. The temporary suspension of the U.S.–China tariff dispute faded from focus, offering little support.

By the close, only the Dow and S&P 500 managed to claw back into positive territory, while the Nasdaq remained in the red.

Investor sentiment remains cautiously optimistic. Recession fears have started to ease, helping lift markets, but a range of uncertainties continues to form a “wall of worry.”

The key question now is whether the current rally can broaden and sustain its momentum through the summer—or if it’s nearing exhaustion and vulnerable to a correction.

The tech sector has led the charge this week (excluding today), with standout performances from Nvidia and Tesla—both up over 14%. Meta, Amazon, and Alphabet have also posted solid gains.

On the economic front, April’s Producer Price Index (PPI) surprised to the downside, falling 0.5% month-over-month versus expectations of a 0.3% increase.

Retail sales rose 0.1%, in line with forecasts. Despite the positive inflation data, Fed Chair Jerome Powell cautioned that inflation could remain volatile.

Interestingly, the inflation surprise index dropped to its lowest level since 2020, fueling gains across a wide range of assets—including stocks (excluding the Nasdaq), bonds, gold, bitcoin, and crude oil.

Meanwhile, global uncertainty remains elevated, with the World Uncertainty Index still at record highs, as noted by ZeroHedge.

Can equities break through this glass ceiling—or is a pullback looming?

Read More

Market Uncertainty Persists Despite Positive Middle East Headlines

Ulli Market Commentary Contact

[Chart courtesy of MarketWatch.com]

  1. Moving the market

Equities were mixed in early trading but gained some ground as bullish sentiment persisted.

The tech sector continued to lead, with Nvidia rising over 2% following news that Saudi Arabia purchased 18,000 of its highly rated AI chips. Fellow chipmaker AMD surged more than 7% due to a $6 billion buyback.

The S&P 500 finally reached positive territory for the year, despite previously being more than 20% below its record high set in February. With the easing of tariff wars and the reduction of levies, particularly between the U.S. and China, traders have shifted from bonds to equities, driving the S&P 500 above its widely followed 200-day moving average.

Whether this rebound has the momentum to push the indexes higher remains uncertain. Has this epic surge come too far too fast?

Despite positive headlines from the Middle East, attributed to Trump’s deal-making skills, market follow-through was weak, with only the Nasdaq closing solidly in the green.

Uncertainty persisted as bond yields continued their upward trend, with the 10-year yield topping 4.5% and the 30-year yield approaching 5%, as rate-cut expectations diminished.

Gold dropped again, losing its $3,200 level, and settling at one-month lows, while the dollar fluctuated to close unchanged. Crude oil drifted lower, as did Bitcoin, though the cryptocurrency found support at the $103k level.

More potentially market-moving data is due out tomorrow, including Retail Sales and the Producer Price Index (PPI).

Read More

S&P 500 And Nasdaq Return To Positive Territory, Lagging Behind Gold

Ulli Market Commentary Contact

[Chart courtesy of MarketWatch.com]

  1. Moving the market

Early gains helped the S&P 500 and Nasdaq return to positive territory for the year, although both are still trailing gold’s performance by over 23%. Nvidia boosted the Nasdaq with a 7% rise in early trading, while the Dow remained in the red.

Sentiment remains positive following yesterday’s surge, with traders pleased that Trump secured more tariff concessions from China than expected. His chip deal in Saudi Arabia and reduced inflation fears further fueled bullish enthusiasm.

The CPI rose 2.3% annually in April, slightly below the 2.4% forecast. Core inflation held steady at 2.8%, matching consensus estimates. The inflation data surprise index hit its lowest level since August 2020.

The most shorted stocks continued their upward squeeze, marking their largest 40-day jump since December 2023. The MAG 7 basket has gained 7% since last Friday, and even retail stocks, impacted by the tariff war, have rebounded.

Bond yields continued to rise as rate-cut expectations declined. The dollar surrendered most of its gains, while Bitcoin, oil prices, and gold recovered.

Gold gained 0.82%, and silver rallied over 1%.

Read More

Equities Rally On Productive U.S.-China Trade Talks

Ulli Market Commentary Contact

[Chart courtesy of MarketWatch.com]

  1. Moving the market

Equities surged at the opening following news that the U.S. and China agreed to temporarily slash tariffs after weekend negotiations in Switzerland.

Treasury Secretary Bessent described the talks as “very productive,” with both parties agreeing to cut reciprocal tariffs by 115% for nine days. Specifically, this means the U.S. will reduce Chinese tariffs to 30%, while China will lower tariffs on U.S. imports to 10%.

Bessent expects to meet again with the Chinese representative in the coming weeks to finalize a more comprehensive agreement.

Traders breathed a sigh of relief, and the markets responded with exuberance, pushing the S&P 500 back above its 200-day moving average (DMA) and slightly into positive territory for the year. Despite some uncertainty being alleviated, market volatility may persist until a final trade agreement is reached.

Today’s massive rally also pushed our domestic Trend Tracking Indicator (TTI) back above its trend line, though this is just the first attempt, and the sustainability of this move remains to be seen.

We saw the second-largest short squeeze of the year, as rate-cut expectations plummeted along with recession odds. Bond yields rose as traders shifted towards equities, favoring the dollar, and causing gold to drop, although the precious metal found support at the $3,200 level.

Crude oil maintained its overnight gains, while Bitcoin surged to nearly $106k overnight before retreating to $102k during the day session.

Bitcoin remains aligned with global liquidity (with a three-month lag), and some traders are now forecasting a price point above $150k by July.

Will these predictions prove accurate?

Read More