
ETF Tracker StatSheet
You can view the latest version here.
INTEL SINKS, BUT MARKET STILL ENDS WEEK HIGHER

- Moving the markets
Friday was a snooze-fest for the S&P 500, which barely budged amid a slew of lackluster earnings reports. Intel was the biggest loser, plunging 11% after issuing a dismal outlook for the first quarter.
Other stocks like KLA Corp and Visa also disappointed investors with weak guidance and slowing growth.
But hey, it’s not all doom and gloom. The market still managed to end the week on a positive note, thanks to some upbeat economic data. The core PCE index, the Fed’s favorite inflation measure, came in as expected for December, while the GDP and PCE numbers for the week were also reassuring. Traders are hoping for a ‘Goldilocks’ scenario, where the economy cools down a bit but stays in the green.
However, not everything is as rosy as it seems. The S&P 500 may be hovering near record highs, but that’s mostly driven by a few mega-cap tech stocks. The Value Line Geometric Index, which tracks the median performance of about 1,700 North American companies, is still 17% below its peak from November 2021. That shows how uneven the market recovery has been.
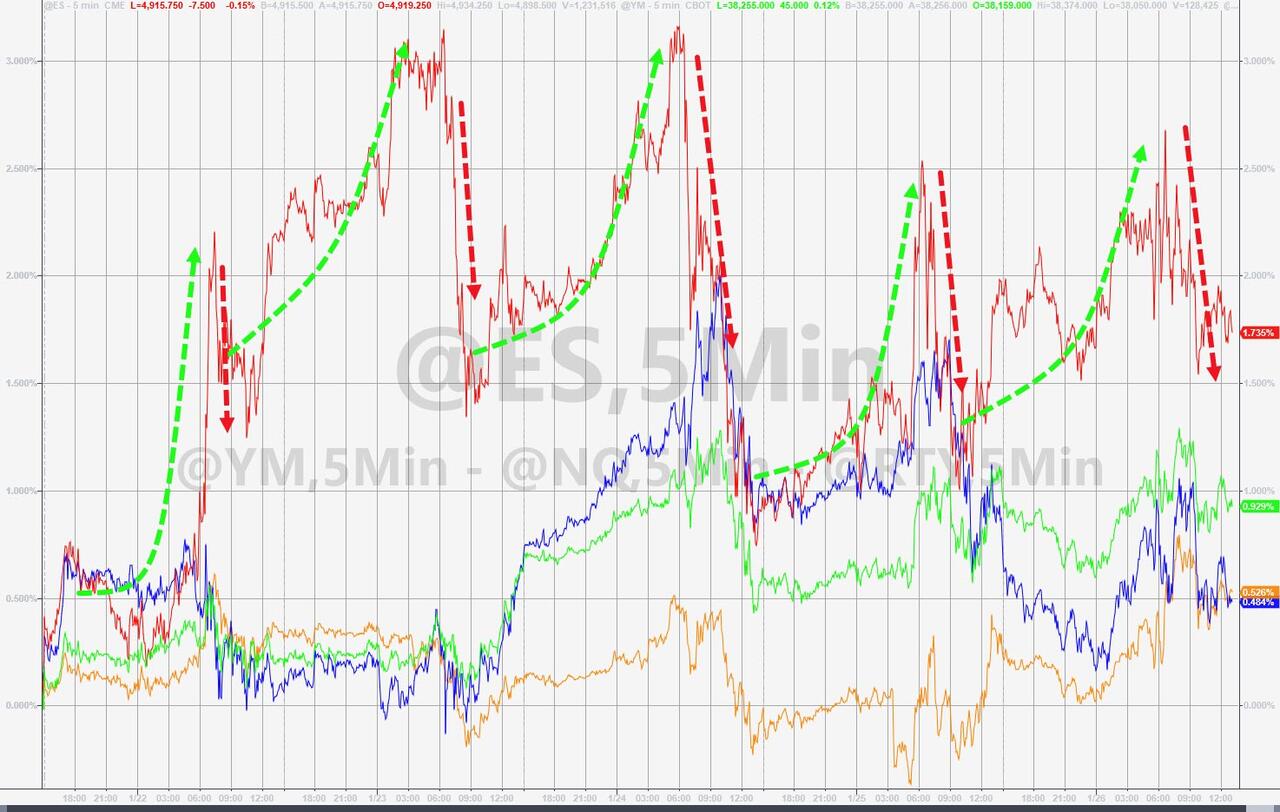
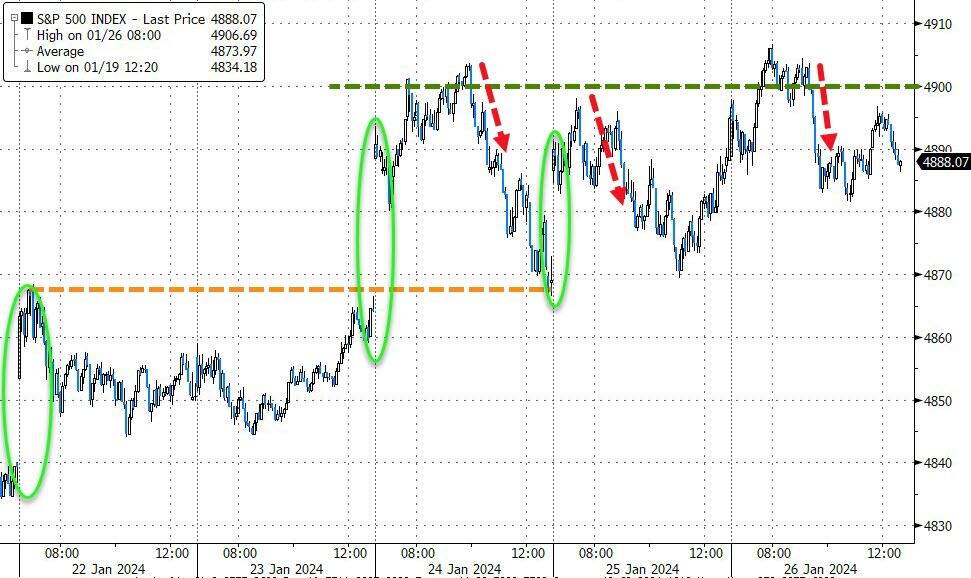
Meanwhile, the rest of the market was pretty mixed this week. Small caps outshone their larger peers, while the Dow and Nasdaq lagged. The S&P 500 tried and failed three times to break above 4,900 but was rejected each time.
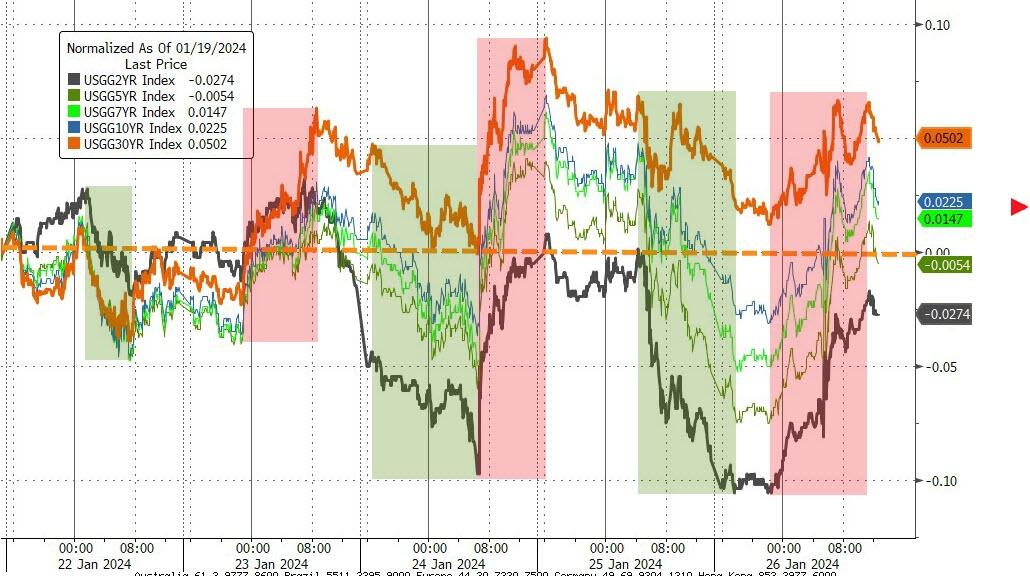
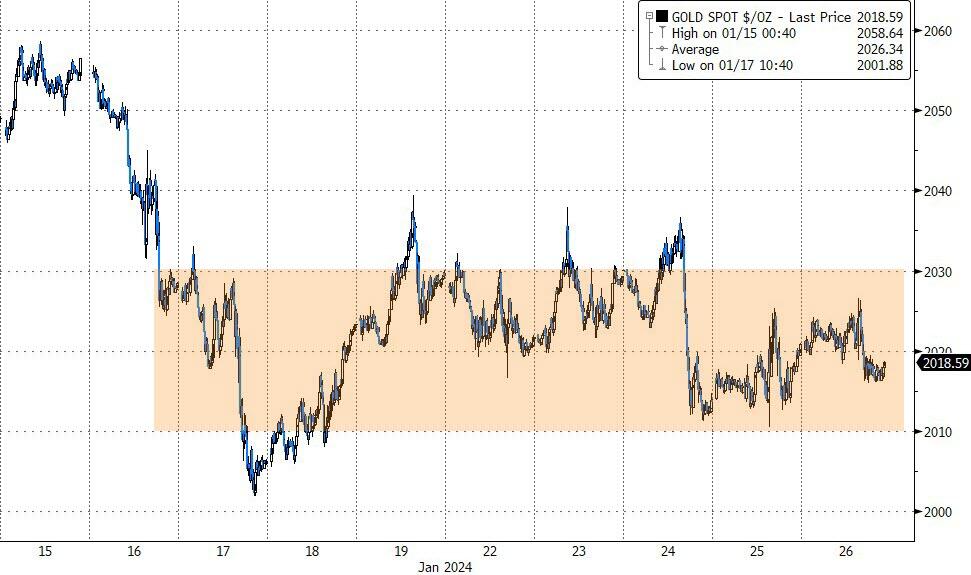
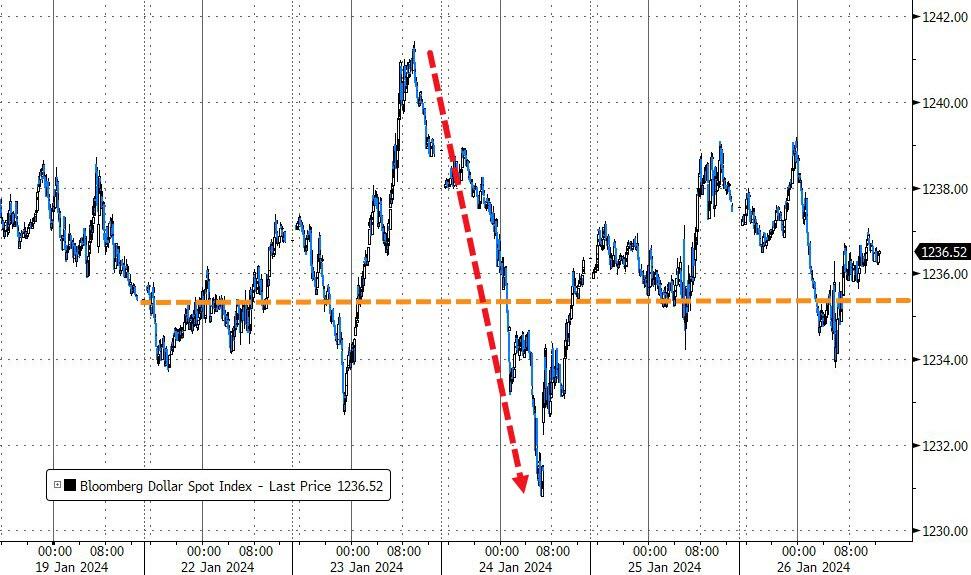
Bond yields rose today but were flat for the week. Gold was also stagnant, while the dollar edged up slightly.
And here’s a fun fact that you won’t hear on the news: the Fed just posted a whopping $114 billion loss for the year, the largest in its history:

That puts it third on the list of the biggest bankruptcies in America, behind only Lehman Brothers and Washington Mutual.
How’s that for confidence in the Central Bank?
2. Current “Buy” Cycles (effective 11/21/2023)
Our Trend Tracking Indexes (TTIs) have both crossed their trend lines with enough strength to trigger new “Buy” signals. That means, Tuesday, 11/21/2023, was the official date for these signals.
If you want to follow our strategy, you should first decide how much you want to invest based on your risk tolerance (percentage of allocation). Then, you should check my Thursday StatSheet and Saturday’s “ETFs on the Cutline” report for suitable ETFs to buy.
3. Trend Tracking Indexes (TTIs)
The market was mostly flat today, with the major indexes barely moving from their previous levels. Our TTIs also declined slightly, but they are still well above the zero line.
This is how we closed 1/26/2024:
Domestic TTI: +7.30% above its M/A (prior close +7.56%)—Buy signal effective 11/21/2023.
International TTI: +6.69% above its M/A (prior close +6.77%)—Buy signal effective 11/21/2023.
All linked charts above are courtesy of Bloomberg via ZeroHedge.
———————————————————-
WOULD YOU LIKE TO HAVE YOUR INVESTMENTS PROFESSIONALLY MANAGED?
Do you have the time to follow our investment plans yourself? If you are a busy professional who would like to have his portfolio managed using our methodology, please contact me directly to get more details.
—————————————————————-
Contact Ulli