

- Moving the markets
The Dow Jones Industrial Average had a bad day, retreating from its all-time highs as traders sifted through the latest earnings reports, while the S&P 500 and Nasdaq squeezed out a positive finish after shaking off some midday jitters.
The 30-stock index was dragged down by a 12% plunge in 3M, which issued a gloomy outlook. On the bright side, airlines soared together, while Verizon and Proctor and Gamble cushioned the blow for the Dow by rising more than 5% and 4% respectively.
But traders are on edge and wondering how long the party can last, especially since the rally this year has been driven by tech stocks such as Nvidia, while the rest of the market has lagged. This month alone, Nvidia is up 20%. In contrast, the small cap Russell 2000 is down by more than 1%.
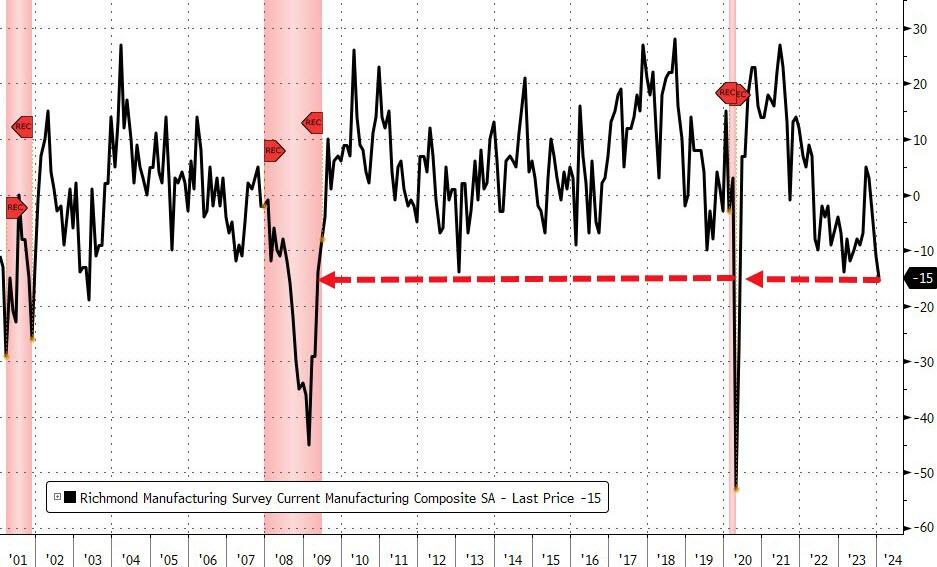
On the economic front, we learned that the Richmond Fed Manufacturing survey tanked to its lowest since Covid. The index nosedived to -15, much worse than the expected -8, which indicates a contraction.
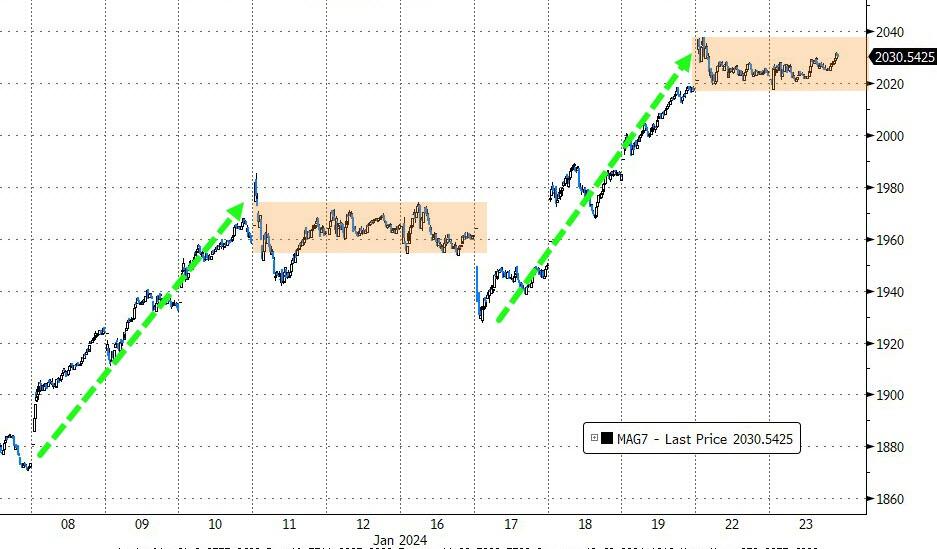
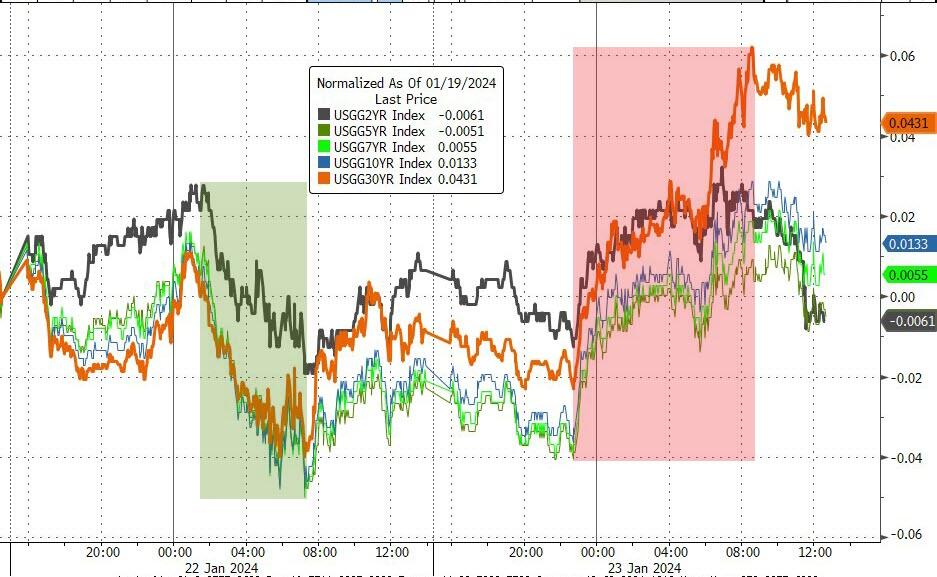
The Mag7 stocks crept higher but remained within their 2-day trading range. Bond yields bounced back and wiped-out yesterday’s losses.
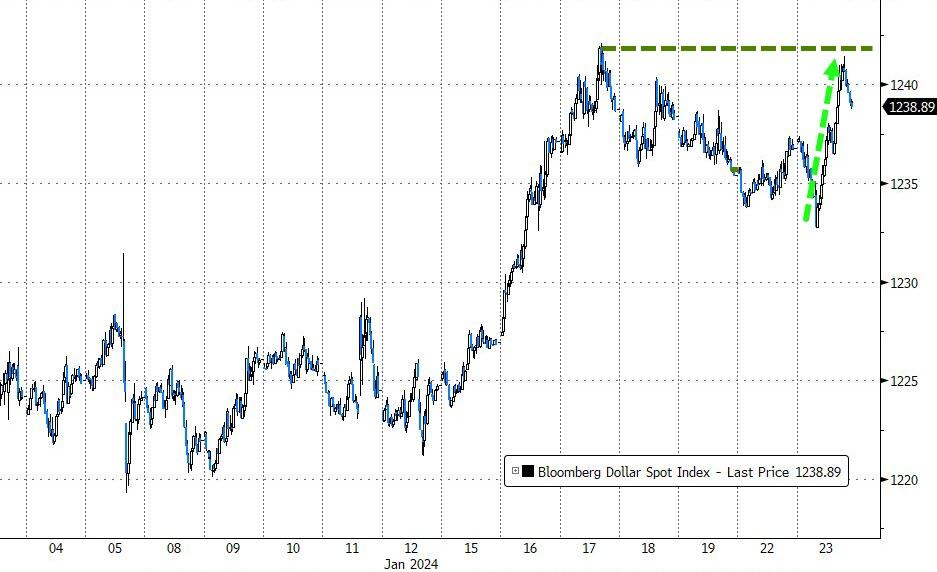
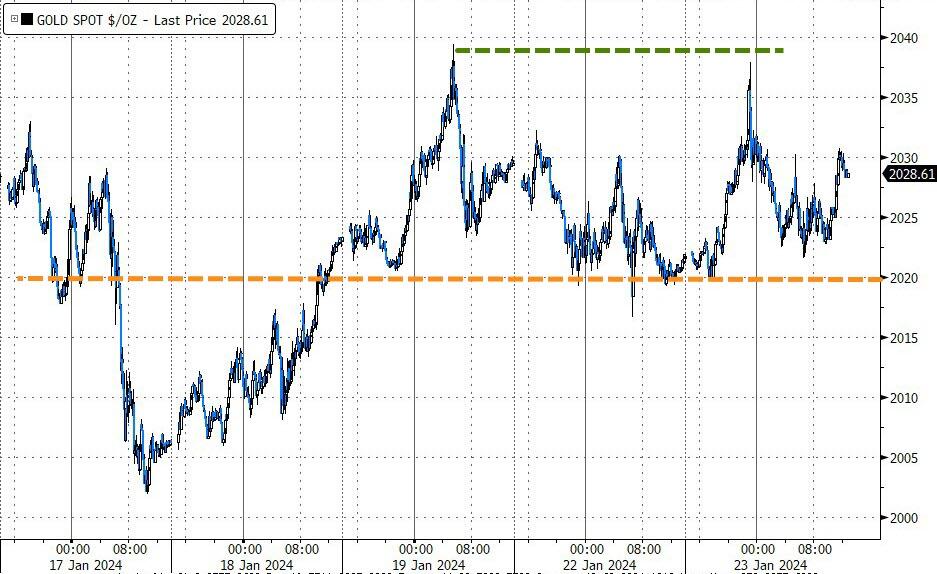
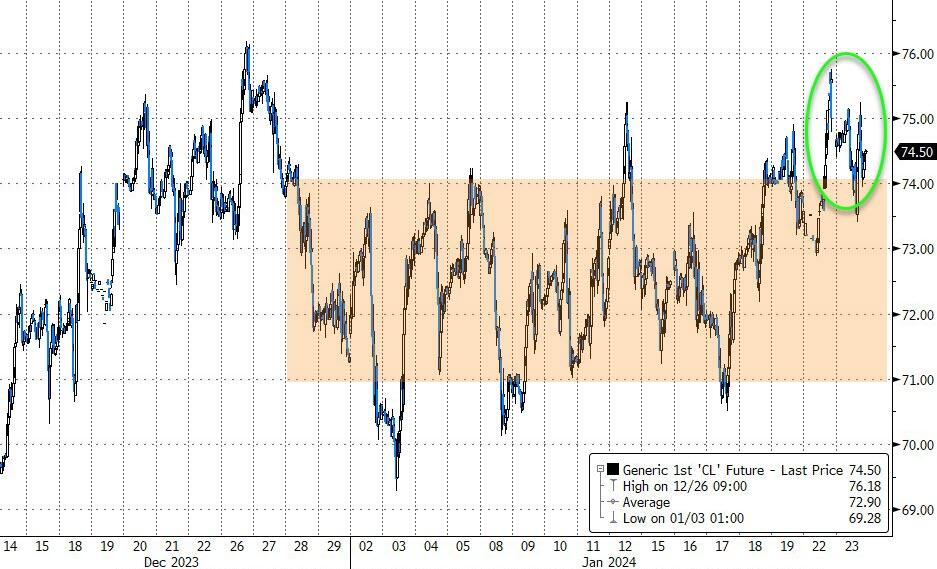
The dollar surged to last week’s 2024 highs, and for some mysterious reason gold followed suit instead of moving in the opposite direction from the US currency. Crude oil swung wildly and ended the session flat.
After the crash of the Chinese stock market, authorities tried to prop it up by announcing a multi-billion-dollar buying spree which, as ZeroHedge put it, “barely managed to get the broadest measure of Chinese stocks higher.”
It seems that when it’s over, it’s really over. Should the rest of the world take notes?
2. Current “Buy” Cycles (effective 11/21/2023)
Our Trend Tracking Indexes (TTIs) have both crossed their trend lines with enough strength to trigger new “Buy” signals. That means, Tuesday, 11/21/2023, was the official date for these signals.
If you want to follow our strategy, you should first decide how much you want to invest based on your risk tolerance (percentage of allocation). Then, you should check my Thursday StatSheet and Saturday’s “ETFs on the Cutline” report for suitable ETFs to buy.
3. Trend Tracking Indexes (TTIs)
The market had a sluggish opening, but most of the major indexes rallied in the afternoon and finished higher, except for the Dow, which closed lower.
Our TTIs also rose slightly and moved further away from their trend lines.
This is how we closed 1/23/2024:
Domestic TTI: +7.04% above its M/A (prior close +6.99%)—Buy signal effective 11/21/2023.
International TTI: +6.01% above its M/A (prior close +5.86%)—Buy signal effective 11/21/2023.
All linked charts above are courtesy of Bloomberg via ZeroHedge.
———————————————————-
WOULD YOU LIKE TO HAVE YOUR INVESTMENTS PROFESSIONALLY MANAGED?
Do you have the time to follow our investment plans yourself? If you are a busy professional who would like to have his portfolio managed using our methodology, please contact me directly to get more details.
Contact Ulli