Weekly StatSheet For The ETF Tracker Newsletter – Updated Through 02/22/2018

Ulli ETF StatSheet Contact

ETF Data updated through Thursday, February 22, 2018

Methodology/Use of this StatSheet:

  1. From the universe of over 1,800 ETFs, I have selected only those with a trading volume of over $5 million per day (HV ETFs), so that liquidity and a small bid/ask spread are assured.
  2. Trend Tracking Indexes (TTIs)

Buy or Sell decisions for Domestic and International ETFs (section 1 and 2), are made based on the respective TTI and its position either above or below its long-term M/A (Moving Average). A crossing of the trend line from below accompanied by some staying power above constitutes a “Buy” signal. Conversely, a clear break below the line constitutes a “Sell” signal. Additionally, I use a 7.5% trailing stop loss on all positions in these categories to control downside risk.

  1. All other investment arenas do not have a TTI and should be traded based on the position of the individual ETF relative to its own respective trend line (%M/A). That’s why those signals are referred to as a “Selective Buy.” In other words, if an ETF crosses its own trendline to the upside, a “Buy” signal is generated. Since these areas tend to be more volatile, I recommend a wider trailing sell stop of 7.5% -10% depending on your risk tolerance.

If you are unfamiliar with some of the terminology, please see Glossary of Terms and new subscriber information in section 9.


  1. DOMESTIC EQUITY ETFs: BUY — since 4/4/2016
Click on chart to enlarge

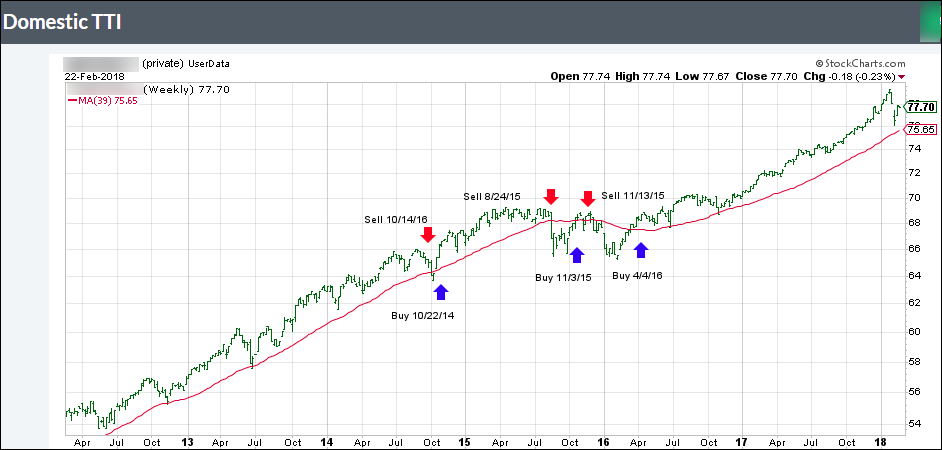
Our main directional indicator, the Domestic Trend Tracking Index (TTI-green line in the above chart) is positioned above its long-term trend line (red) by +2.85% after having generated a new Domestic Buy signal effective 4/4/2016 as posted.
Read More

Another Rally Bites The Dust

Ulli Market Commentary Contact

[Chart courtesy of MarketWatch.com]
  1. Moving the markets

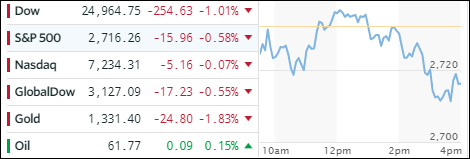
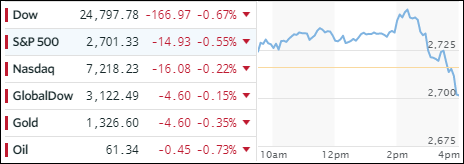
In a repeat performance from yesterday, we watched an early rally lose steam and head back south below the unchanged line, when last minute buying pushed the Dow and Nasdaq higher to close in the green. However, the Nasdaq slid for the 4th day in a row. Ongoing concerns about rising inflation and bond yields took center stage.

To calm the markets after yesterday’s tumultuous release of the minutes, the Fed paraded one of its mouthpieces, Fed President James Bullard, to calm the troops by reiterating that “everything needs to be perfect” for 4 rate hikes. That comment had the desired effect early on but did not last for the entire session.

However, Bullard did have an effect on Treasury yields, which slipped today with the 10-year giving back 2 basis points to 2.92% thereby postponing the day when the 3% level will be surpassed. After its recent bounce-back, thanks to higher yields, the US Dollar (UUP) headed back south and lost -0.34%. We are still at that moment in time where the markets could either resume its long-term bullish trend or collapse to test its recent sell-off lows.

Read More

Equities Dive As Bond Yields Spike

Ulli Market Commentary Contact

[Chart courtesy of MarketWatch.com]
  1. Moving the markets

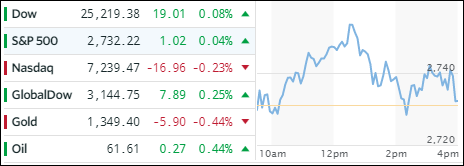
We started today’s session on a positive note when the major indexes suddenly ran into a brick wall, reversed course and headed south with a vengeance with the Dow giving up a 300 point gain and plunging 500 points. The day turned out tumultuous, after the minutes from the Fed were released, causing volatility to rise (VIX back to 20) and giving the bears the upper hand.

The Fed minutes showed that that the economy was strengthening increasing the likelihood of more rates hikes ahead as had been previously assumed. It’s also a sign that inflation worries are justified and a more aggressive hike schedule may be on the horizon increasing borrowing costs not just for corporations but private borrowers as well.

The 10-year bond reacted promptly after the minutes were released, and its yield spiked 6 basis points to close at 2.94%. We’ll now have to see if/when the psychologically important 3% barrier will be broken to the upside and what the effect on equities will be. Benefitting from higher bond yields was the US Dollar (UUP) which, after an opening dump, reversed to close up +0.38%.

None of our trailing sell stops were affected by this 2-day sell-off.

Read More

Snapping A 6-Day Win Streak

Ulli Market Commentary Contact

[Chart courtesy of MarketWatch.com]
  1. Moving the markets

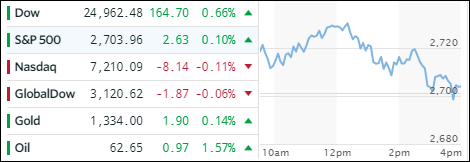
There was nothing exciting about today’s session other than a brief mid-day climb above the unchanged line, after which the major indexes hit the skids with the Dow and S&P snapping a 6-day winning streak. It’s still too early to determine if today’s action was the end of the current dead-cat bounce, as some analysts named last week’s rebound.

Not helping matters or instilling confidence was Wal-Mart’s earnings-related swan dive, which was its biggest one-day decline in 30 years (-10.18%). Yesterday, when the markets were closed for Presidents Day, the futures showed the plunge of the cash market at the open—except there was no opening! Someone forgot to turn off the computers confirming again for those who still don’t know that markets are manipulated and programs will be run as long as the power switch is on.

The VIX headed back above 20, and Treasury yields rose with the 10-year adding 1 basis point to end at +2.91%, its highest level since early 2014. That took any starch out of the mid-day rally attempt. The US Dollar (UUP) turned around and surged +0.64%, seemingly helped by the Chinese New Year Holiday.

Read More

ETFs On The Cutline – Updated Through 02/16/2018

Ulli Uncategorized Contact

Below please find the latest High Volume ETFs Cutline report, which shows how far above or below their respective long-term trend lines (39 week SMA) my currently tracked ETFs are positioned.

This report covers the HV ETF Master List from Thursday’s StatSheet and includes 366 High Volume ETFs ETFs, defined as those with an average daily volume of more than $5 million, of which currently 224 (last week 173) are hovering in bullish territory. The yellow line separates those ETFs that are positioned above their trend line (%M/A) from those that have dropped below it.

Take a look:

The HV ETF Master Cutline Report

In case you are not familiar with some of the terminology used in the reports, please read the Glossary of Terms.

If you missed the original post about the Cutline approach, you can read it here.

ETF Tracker Newsletter For February 16, 2018

Ulli ETF Tracker Contact

ETF Tracker StatSheet

https://theetfbully.com/2018/02/weekly-statsheet-etf-tracker-newsletter-updated-02-15-2018/

 COMEBACK WEEK

[Chart courtesy of MarketWatch.com]
  1. Moving the markets

A solid mid-day rally hit the skids, as news from Special Counsel Mueller’s indictment of 13 Russian nationals and three Russian entities, accusing them of interfering with the US elections, flashed on computer screens around the world. The major indexes dove, briefly slipped into the red but recovered to close around their unchanged lines. Nevertheless, it was a crazy comeback-week in the markets (S&P 500 +4.3%), which ZH summarized like this:

  1. Nasdaq, S&P – best week since Dec 2011
  2. Dow – best week since Nov 2016
  3. Small Caps – best week since Dec 2016
  4. “Most Shorted” Stocks – biggest weekly short-squeeze since Nov 2016
  5. VIX – biggest weekly drop since Nov 2016
  6. US Treasury Yield Curve – 2nd biggest weekly flattening since Sept 2011
  7. HYG (HY Bond ETF) – best week since Feb 2016 (despite record outflows)
  8. Dollar Index – 2nd worst week in 6 months
  9. Gold – best week since April 2016

Giving equities an assist this week was a jump in bullish sentiment numbers and signs that the economy is growing but not yet overheating as had been feared. The 10-year bond yield seemed to support that view, if only for the time being, by slipping 3 basis points to end at +2.87%. At least the race towards the 3% mark has been halted.

The US Dollar Index (UUP) did its best imitation of a swan dive during the past 5 trading sessions thereby pushing all commodities higher. However, today UUP managed to bounce back +0.69%.

Budget deficits have been a non-addressed issue for a long time. Now, that the debt ceiling has been postponed for 2 years, we will see larger negative numbers for years to come. For some insight and the consequences, please see Simon Black’s excellent article.  

Read More