ETF Tracker StatSheet
https://theetfbully.com/2017/09/weekly-statsheet-etf-tracker-newsletter-updated-09212017/
EKING OUT SMALL GAINS
- Moving the Markets
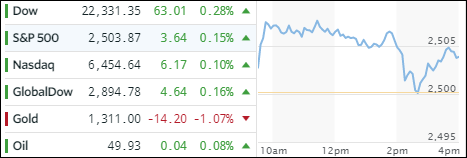
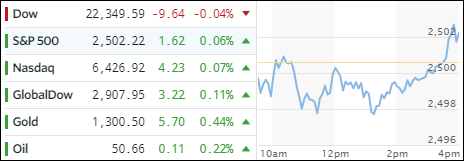
A late bounce helped the major indexes to gain enough upward momentum to eke out some small gains for the session with the exception of the Dow, which fell short and remained in the red. Despite this rebound, Apple (AAPL) continued its September downward trend having lost now -7.4%, as the company experienced its worst week ahead of an iPhone launch in over 7 years. Going the opposite direction were SmallCaps with the Russell 2000 ending at a record, which is its first record close since July 25th. While there is no guarantee, this move to new all-time highs can certainly be considered as a bullish indicator.
Despite the meandering of the major indexes, things ended on a much more solid footing in ETF space. Leading the pack to the upside were Semiconductors (SMH), SmallCaps (SCHA) and Transportations (IYT) with gains of +0.41%, +0.40% and +0.33% respectively. We saw the only red number in Emerging Markets (SCHE) with -0.58%.
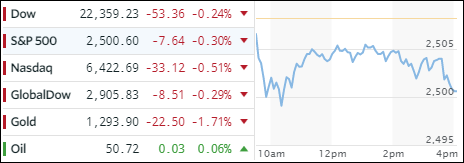
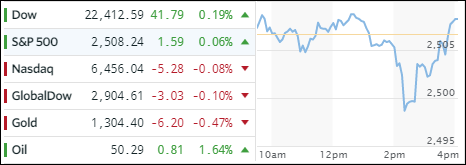
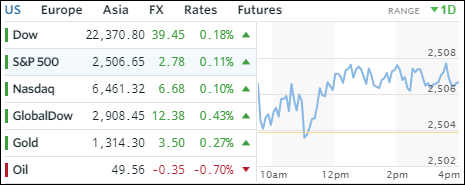
In the interest rate arena, the yield on the 10-year Treasury bond pulled back 1 basis point to 2.26%, which helped the 20-year bond price gain +0.29%. Gold managed to conquer its $1,300 level again but only barely. The US Dollar completed its best 2-week rally since December but lost a tiny -0.08% for the day. However, the downward trend remains intact.