- Moving the markets
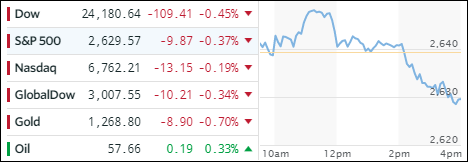
It was a tug-of-war between bulls and bears with the major indexes vacillating back and forth above and below their respective unchanged lines. In the end, only the Nasdaq managed to show a green number, although the S&P scored a close second. The Energy sector as a whole looked frail with XLE losing -1.30%, but Crude Oil was the real weakling of the day and got spanked at the tune of -2.86%.
In ETF space, we again had more losers than winners. On the upside, we saw Aerospace & Defense (ITA) logging in a gain of +0.85% while Semiconductors (SMH) finally ended up in the green by adding a modest +0.23%. Giving back some of its YTD gains were Emerging Markets (SCHE) with -1.17% and International SmallCaps (SCHC) with -0.72%.
Interest rates dropped slightly after their recent push higher with the 10-Year bond yield losing 3 basis points to close at 2.33%. That allowed the 20-year bond (TLT) to rally +0.35% to close above its recent high at a level last seen in September. Gold stayed just about even, but the US Dollar (UUP) rallied for the 3rd straight day by adding +0.25% to kiss its 50-day M/A.