- Moving the markets
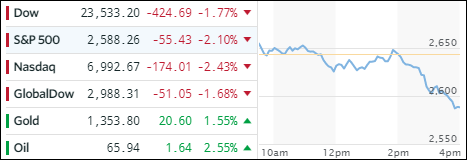
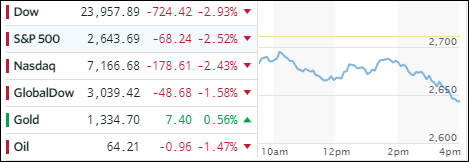
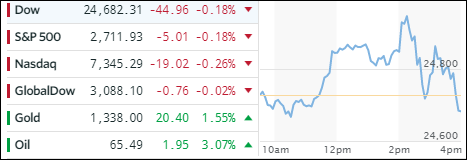
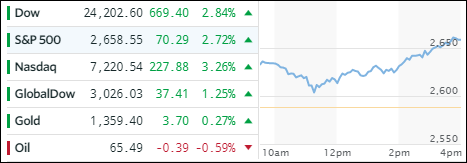
The much feared wave of selling that dominated last week came to a sudden end when the major indexes opened higher, pulled back slightly and then rocketed into the close thereby recording their largest one-day percentage gains since the middle of 2015. The bulls finally showed signs of life supported by reports that behind the scenes talks between the US and China, to avoid a global trade war, showed some promise.
Technically speaking, today’s rebound was a repeat of the one we saw on February 8 when the S&P 500 bounced off its 200-day M/A, which was exactly what happened today. So, today’s market action can be just as much attributed to technical factors as the trade talk rumors.
Nevertheless, today’s recovery wiped out just about half of the losses sustained last week. As I mentioned in Friday’s post, the “Sell” signal generated by the International TTI would be subject to this morning’s market behavior. This what I said:
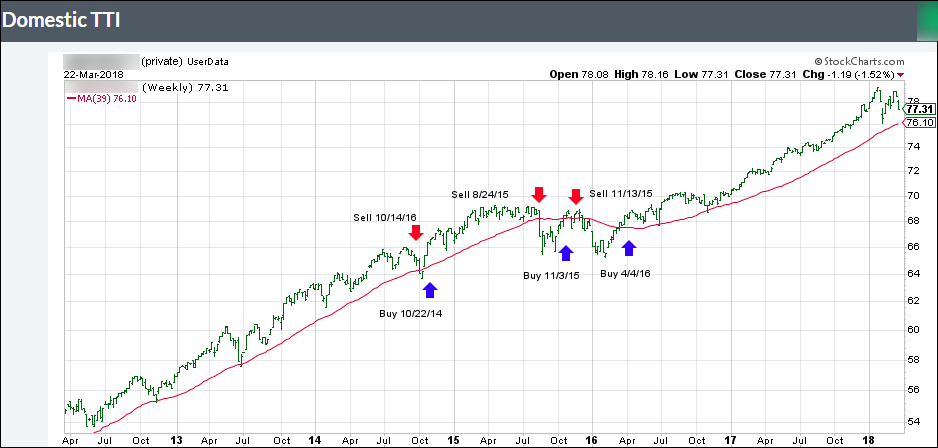
Today’s action sent our Trend Tracking Indexes (TTIs) much lower (see section 3), and we have a split picture. While the Domestic one remains in bullish territory by +0.83%, the International one has breached its long-term trend line to the downside by -0.45%, which means a “Sell” signal for this arena has been generated and all broadly diversified international ETFs should be sold.
They way I do this in my advisor practice is that I will first observe the markets on Monday morning to see if a rebound is in the making. If there is, I will hold off with my liquidation plans. If the markets, however, show continued weakness, I will follow through and sell those ETFs that are affected.
Needless to say, the rebound was in the making, and I held off with my liquidations plans for the time being. They will be revisited once the TTI drops back below its long-term moving average.
Green was the dominant color of the day, and all of our current ETF holdings rallied to varying degrees. Heading the group were Semiconductors (SMH +3.98%), Emerging Markets (SCHE +3.24%) and Financials (XLF +3.24%).
Interest rates moved up with the 10-year bond yield gaining 3 basis points to 2.85%, while the US Dollar (UUP) took a dive and lost -0.47%.
While today’s rebound was certainly welcome after last week’s drubbing, it’s far from certain whether this is another dead cat bounce, that will come back down to test the S&P’s 200-day M/A again, or an attempt to take out the all-time highs. We have to be prepared to deal with either possibility where the latter requires no action on our part while the former might bring another “Sell” signal into play.