- Moving the markets
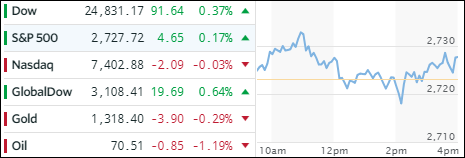
Despite the Dow sporting an 8-day winning streak, an early rally fizzled into the close with the major indexes barely hanging on above their respective unchanged lines. The gains were modest with the leader being energy and health care, while real estate, telecommunications and industrials lagged.
Today’s rally was supported by the perception that trade issues with China may be resolved as new talks are scheduled for this week. President Trump was working with the Chinese Premier to find a solution to keep the Chinese telecom giant ZTE from going out of business as a result of previous sanctions. I guess Wall Street sees the possibility of improved relations when “one hand washes the other.”
While optimism over the recent earnings season reigns supreme, the fly in the ointment continues to be higher interest rates with the 10-year bond yield rising again and closing at the psychologically important 3% level. Last time this occurred (middle of April), the S&P 500 took a 100 point dive. It’ll be interesting to see if this glass ceiling holds again or if equities can overcome this resistance point and rally higher.