
- Moving the markets
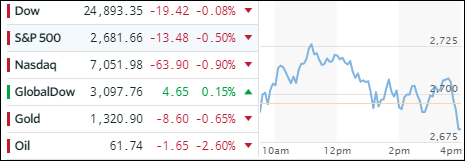
The session started out with the bullish sentiment intact from yesterday’s rebound but ended with the bears taking over causing the major indexes to close at the lows of the day. The cause was “yield creep” as rates continued their march higher with the 10-year yield climbing 5 basis points to end the day at 2.84%, a level that was reached last Friday when the mini-crash began. In other words, the tug-of-war between bulls and bears could very well continue with volatility being our companion for a while.
The ETF space we’re involved in can be best described as mixed. Closing in the green was Aerospace & Defense (ITA +1.36%), Transportations (IYT +0.28%) and Financials (XLF +0.07%). On the downside, Emerging Markets (SCHE -2.80%) led with Semiconductors (SMH -2.64%) in close pursuit giving back some of yesterday’s large gains.
Commodities in general were spanked, while the US Dollar (UUP) continued its mini-rebound by gaining a solid +0.77%. As interest rates rise, bonds are getting clobbered with the widely held 20-year TLT losing another -0.95% and reaching a level last touched in May 2017.
- ETFs in the Spotlight
In case you missed the announcement and description of this section, you can read it here again.
It features 10 broadly diversified and sector ETFs from my HighVolume list as posted every Saturday. Furthermore, they are screened for the lowest MaxDD% number meaning they have been showing better resistance to temporary sell offs than all others over the past year.
The below table simply demonstrates the magnitude with which some of the ETFs are fluctuating in regards to their positions above or below their respective individual trend lines (%M/A). A break below, represented by a negative number, shows weakness, while a break above, represented by a positive percentage, shows strength.
For hundreds of ETF choices, be sure to reference Thursday’s StatSheet.
Year to date, here’s how our candidates have fared so far:
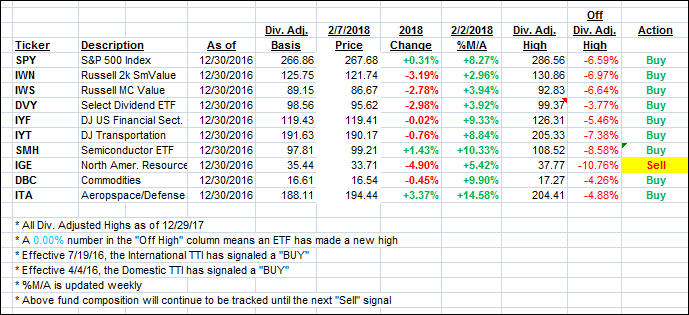
Again, the %M/A column above shows the position of the various ETFs in relation to their respective long term trend lines, while the trailing sell stops are being tracked in the “Off High” column. The “Action” column will signal a “Sell” once the -7.5% point has been taken out in the “Off High” column.
- Trend Tracking Indexes (TTIs)
Our Trend Tracking Indexes (TTIs) went south as the major indexes took a dive into the close.
Here’s how we closed 2/7/2018:
Domestic TTI: +2.44% above its M/A (last close +2.76%)—Buy signal effective 4/4/2016
International TTI: +3.25% above its M/A (last close +3.95%)—Buy signal effective 7/19/2016
Disclosure: I am obliged to inform you that I, as well as my advisory clients, own some of the ETFs listed in the above table. Furthermore, they do not represent a specific investment recommendation for you, they merely show which ETFs from the universe I track are falling within the guidelines specified.
Contact Ulli