
ETF Tracker StatSheet
Up For The Week But Running Out Of Steam For The Day
- Moving the markets
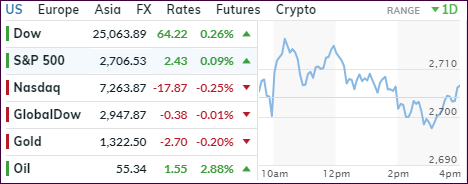
Choppy and sloppy best describes the last trading day, a week during which the major indexes gained but ran out of steam, as an early rally faded into the close with the Dow coming off the high by some 150 points.
Despite the Nasdaq notching a 1.4% rise over the past 5 days, today it was the anchor that kept any advances in check predominantly due to Amazon’s earnings announcement that revenues for the Q1 2019 would fall short of expectations. Amazon’s stock price has now been down for 2 straight weeks.
For this week, the S&P 500 advanced +1.6%, the Dow added +1.3% while the Nasdaq gained +1.4%. All thanks to the Fed’s slamming on the monetary brakes and caving to Wall Street by signaling “patience” regarding any future policy changes as opposed to the more hawkish behavior shown 3 months ago.
Interest rates rose today with the 10-year bond yield gaining 5 basis points to settle at 2.68%. The driving factor here was the jobs reports showing that the U.S. gained 304k jobs vs. 172k expected, the biggest increase in almost a year. Of course, this number is subject to the usual at times sharp revisions. Case in point is the December figure, which was slashed from an initial estimate of 312k to 222k.
Our Domestic Trend Tracking Index (TTI) inched a tad higher and is now within striking distance of crossing its long-term trend line to the upside and into bullish territory. Please see the exact numbers in section 3 below. If the current bullish sentiment continues, we may very well be inching back into equity ETFs in the near future.
- ETFs in the Spotlight
In case you missed the announcement and description of this section, you can read it here again.
It features 10 broadly diversified and sector ETFs from my HighVolume list as posted every Saturday. Furthermore, they are screened for the lowest MaxDD% number meaning they have been showing better resistance to temporary sell offs than all others over the past year.
The below table simply demonstrates the magnitude with which some of the ETFs are fluctuating regarding their positions above or below their respective individual trend lines (%M/A). A break below, represented by a negative number, shows weakness, while a break above, represented by a positive percentage, shows strength.
For hundreds of ETF choices, be sure to reference Thursday’s StatSheet.
Year to date, here’s how our original candidates from the last cycle have fared:
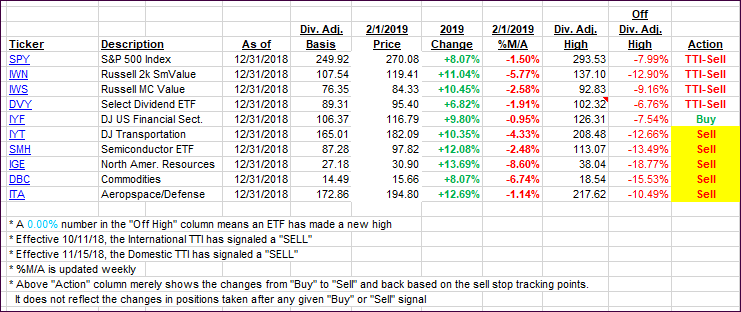
Again, the %M/A column above shows the position of the various ETFs in relation to their respective long-term trend lines, while the trailing sell stops are being tracked in the “Off High” column. The “Action” column will signal a “Sell” once the -8% point has been taken out in the “Off High” column. For more volatile sector ETFs, the trigger point is -10%.
- Trend Tracking Indexes (TTIs)
Our Trend Tracking Indexes (TTIs) inched higher putting us closer to a trend line crossing.
Here’s how we closed 02/01/2019:
Domestic TTI: -0.19% below its M/A (last close -0.38%)—Sell signal effective 11/15/2018
International TTI: -0.97% below its M/A (last close -1.13%)—Sell signal effective 10/11/2018
Disclosure: I am obliged to inform you that I, as well as my advisory clients, own some of the ETFs listed in the above table. Furthermore, they do not represent a specific investment recommendation for you, they merely show which ETFs from the universe I track are falling.
———————————————————-
WOULD YOU LIKE TO HAVE YOUR INVESTMENTS PROFESSIONALLY MANAGED?
Do you have the time to follow our investment plans yourself? If you are a busy professional who would like to have his portfolio managed using our methodology, please contact me directly or get more details at:
https://theetfbully.com/personal-investment-management/
———————————————————
Back issues of the ETF/No Load Fund Tracker are available on the web at:
https://theetfbully.com/newsletter-archives/
Contact Ulli