ETF Tracker Newsletter For September 21, 2018

Ulli ETF Tracker Contact

ETF Tracker StatSheet

https://theetfbully.com/2018/09/weekly-statsheet-for-the-etf-tracker-newsletter-updated-through-09-20-2018/

SLIDING INTO THE WEEKEND

[Chart courtesy of MarketWatch.com]
  1. Moving the markets

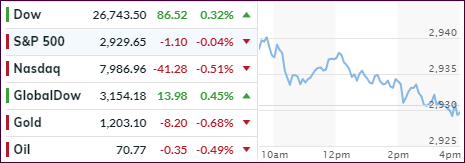
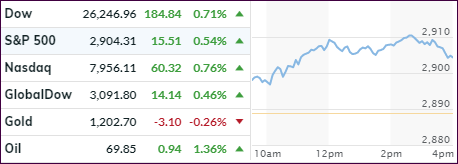
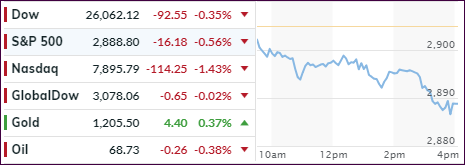
A follow through rally ran into resistance today and slowly but surely petered out with S&P 500 and Nasdaq sliding into the red for the session, while the Dow managed to hang on to a modest gain, which was enough to set another record high. Adding a bit uncertainty was the fact that today was quadruple witching day, along with a massive index reclassification, which caused an increase in volume to a level last seen in July of 2010.

The tech sector was the laggard with technology and internet components creating the drag and pulling the Nasdaq down by -0.51%. That turned out to be a break even for the week, while the Dow and S&P 500 added +2.1% and +1.1% respectively. Of course, given Thursday’s impressive advance across the board, it came as no surprise that a “pause” was coming.

The US Dollar continued heading south and coming off its August highs. It has now seen its biggest 2-week drop since January, which helped the Emerging Markets currencies to have their best week since February with the Argentine Peso showing signs of life and soaring.

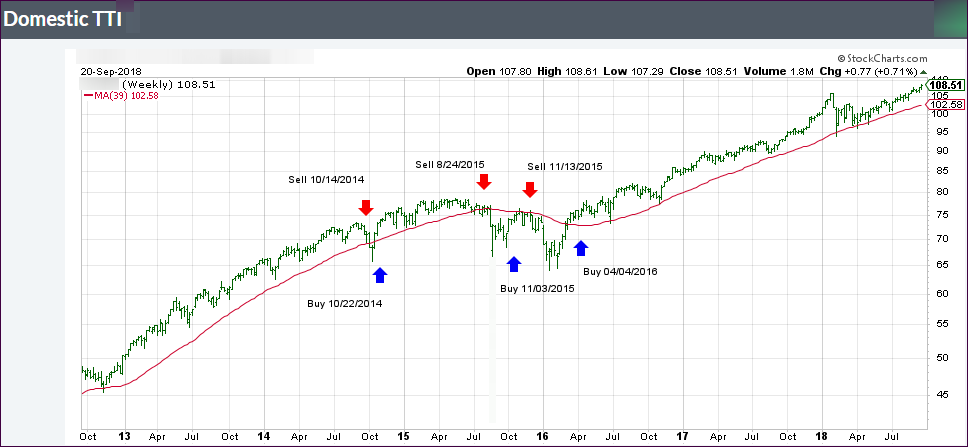
Looking at the global picture, it confirms what I have been saying for a while, which is that the US market, compared to the rest of the world, is the place to be invested in. This chart makes it abundantly clear.

Read More

Weekly StatSheet For The ETF Tracker Newsletter – Updated Through 09/20/2018

Ulli ETF StatSheet Contact

ETF Data updated through Thursday, September 20, 2018

Methodology/Use of this StatSheet:

  1. From the universe of over 1,800 ETFs, I have selected only those with a trading volume of over $5 million per day (HV ETFs), so that liquidity and a small bid/ask spread are assured.
  2. Trend Tracking Indexes (TTIs)

Buy or Sell decisions for Domestic and International ETFs (section 1 and 2), are made based on the respective TTI and its position either above or below its long-term M/A (Moving Average). A crossing of the trend line from below accompanied by some staying power above constitutes a “Buy” signal. Conversely, a clear break below the line constitutes a “Sell” signal. Additionally, I use a 7.5% trailing stop loss on all positions in these categories to control downside risk.

  1. All other investment arenas do not have a TTI and should be traded based on the position of the individual ETF relative to its own respective trend line (%M/A). That’s why those signals are referred to as a “Selective Buy.” In other words, if an ETF crosses its own trendline to the upside, a “Buy” signal is generated. Since these areas tend to be more volatile, I recommend a wider trailing sell stop of 7.5% -10% depending on your risk tolerance.

If you are unfamiliar with some of the terminology, please see Glossary of Terms and new subscriber information in section 9.


  1. DOMESTIC EQUITY ETFs: BUY — since 4/4/2016

Click on chart to enlarge

Our main directional indicator, the Domestic Trend Tracking Index (TTI-green line in the above chart) is positioned above its long-term trend line (red) by +6.01% after having generated a new Domestic Buy signal effective 4/4/2016 as posted.

Read More

Records Are Made To Be Broken

Ulli Market Commentary Contact

[Chart courtesy of MarketWatch.com]
  1. Moving the markets

It took a while, but the Dow finally managed to take out its January high to close in record territory, while the S&P 500 scored its first record since August. The Nasdaq fared well today and moved to within 1.3% off its all-time high, made in August as well.

Economic data took some of the credit for the bullish burst with first-time jobless claims falling and the Fed manufacturing index jumping more than expected. Existing homes sales were the laggard by remaining unchanged in August from the prior month, which was a disappointment as this occurred during the height of the “selling” season. But, as we’ve seen before, bad news will/can be simply ignored in order not upset the bullish theme.

Never mind that nothing has changed regarding the US/China trade war but, here too, it’s more convenient for traders to remain complacent and disregard the mounting frictions. I think that the tariff problems will not go away and most likely move to front and center again when least expected. However, right now they have not been able to take the starch out of upward momentum, so we’ll stay aboard and enjoy the bullish ride for as long as it lasts.

Assisting upward momentum were interest rates, which dropped for a change with the 10-year bond yield coming off its recent high by closing down 2 basis points to 3.065%. The US dollar continued its recent slide by round-tripping but ending off the lows for the day.

Read More

Markets Diverge As Bond Massacre Continues

Ulli Market Commentary Contact

[Chart courtesy of MarketWatch.com]
  1. Moving the markets

Yesterday’s divergence continued with bond yields spiking once more while the markets rallied, although the advance was mixed at best. While the Dow sprinted ahead by over 200 points intraday, the S&P barely held on to the unchanged line, while the Nasdaq hovered below it but managed some damage control towards the end of the session.

Cleary, the bond bears were in charge again with the 10-year yield rising 2 basis points to close at 3.08%, while testing seven-year highs. This 2-day yield spike was not a particularly well-kept secret, as global yields followed suit and surged as well reaching its highest level in 5 years, as this chart from ZH shows.

The fallout from all this was that bondholders got spanked, as the widely held 20-year Bond ETF, (TLT) slipped again and is now showing a loss of some -4.5% over the past few weeks—and this bearish trend may not be over yet.

For sure, the simultaneous advance in equities and bond yields can’t continue forever. Something is bound to give, which means that either bond yields continue to rise, and equities will head south or vice versa. To me, it shows that things are clearly out of whack, but they will surely correct—the timing of it is the big unknown.

Read More

Refueling The Bullish Gas Tank

Ulli Market Commentary Contact

[Chart courtesy of MarketWatch.com]
  1. Moving the markets

Just as quickly as trade war headlines pulled the markets off their lofty highs yesterday, negative sentiment reversed with the bulls refueling their gas tank and pushing the major indexes higher right after the opening bell.

It appears that global investors are favoring the US markets due to continued optimism about the outlook for not just corporate profits but also earnings growth, attributable in part due to the tax-cut bill of 2017.

Never mind that the 10-year bond yield knifed through the 3% level, after several attempts in the recent past, to close solidly above it at 3.05%, its highest point since May. That caused some pain for those holding bonds as part of their portfolio, as the 20-year bond ETF TLT got hammered at the tune of -1.05%. Remember, higher yields equal lower bond prices.

Investors chose to ignore the yield spike and simply kept on going with the bullish equity theme, as if higher bond yields were a good thing for stocks. Who knows how long that meme can last?

Wall Street traders also shrugged off the escalating trade tensions with China by focusing on one thing and one thing only and that was the assumption that this economy is “strong by any measures.” While this may seem odd in the face of previous market reactions, today nothing seemed to stand in the way of bullish sentiment.

While tomorrow may be an entirely different story, for this day, trade wars, imploding emerging market currencies, along with higher bond yields, were a non-event allowing the bulls to wipe out most of yesterday’s losses.

Read More

Markets Sink As Tech Gets Wrecked

Ulli Market Commentary Contact

[Chart courtesy of MarketWatch.com]
  1. Moving the markets

The tariff dispute with China intensified pulling the major indexes off their recent highs, as the tech sector got hammered with the Nasdaq dropping -1.43%, its worst day since late July.

The sudden re-appearance of the US/China trade battles rattled Wall Street, although the unveiling of the $200 billion in tariffs on Chinese products has not been exactly a secret, but with this looming threat not going away, investors decided enough is enough with this uncertainty and south we went.

Adding fuel to the fire was continued doubt as to how the Chinese might retaliate, especially while focusing their views on US corporations doing business in China. But, the fallout spread to the domestic arena as well, with some of the most influential companies, namely Apple and Amazon, getting punished at the tune of -2.7% and -3.2% respectively, which was their biggest loss since April.

This marks the first drop for the S&P 500 in five sessions, but the loss was a modest -0.56%. The FANGs led on the way down and experienced their biggest drop in 2 weeks while, at the same time, closing at a 1-month low.

The US 10-year Treasury yield meandered, crossed the glass ceiling of 3% intra-day but backed off to close below it. As this chart from ZH shows, the 10-year yield has closed higher only once since May 23rd. I believe that it will break through this resistance level soon which, once it does, may have a much-expected adverse impact on equities.

But, with computer algos overseeing the markets, you can never be sure these days about any potential outcome. Only time will tell…

Read More