
- Moving the markets
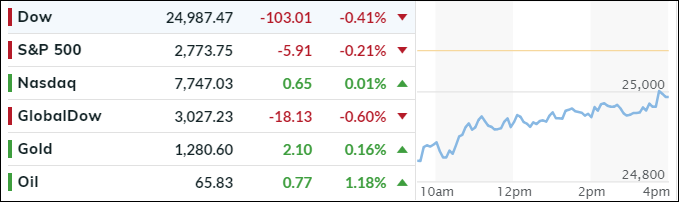
Today, it was trade tensions that kept the markets below the unchanged line, and the bears in charge, although a rebound limited the potential losses and pushed the Nasdaq back to the breakeven point. However, the Dow dropped for the 5th straight day.
Emerging markets continued their downward slide, while foreign markets in general were weak by gapping down and subsequently affecting our International TTI negatively (see section 3). This indicator has now weakened more than its Domestic cousin, an occurrence that has in the past often served as the canary in the coalmine.
As we saw last week, Tech outperformed Financials again while big banks lagged small banks as interest rates were just about unchanged, along with the US Dollar Index (UUP). The 10-year bond yield gave back 1 basis point to end at 2.92%.
Rising energy prices gave an assist to equities by limiting declines caused by fear over the continued U.S.-China trade tensions, as traders are still trying to digest the announced $50 billion tariffs on Chinese imports.
So far, equities have managed to discount a host of negative global economic developments but, for how long can these ongoing and worsening events be ignored? Especially, if a full-blown trade war starts to have a negative impact on corporate earnings. Since that is the big unknown, we will have to wait for the answer to develop.
- ETFs in the Spotlight
In case you missed the announcement and description of this section, you can read it here again.
It features 10 broadly diversified and sector ETFs from my HighVolume list as posted every Saturday. Furthermore, they are screened for the lowest MaxDD% number meaning they have been showing better resistance to temporary sell offs than all others over the past year.
The below table simply demonstrates the magnitude with which some of the ETFs are fluctuating regarding their positions above or below their respective individual trend lines (%M/A). A break below, represented by a negative number, shows weakness, while a break above, represented by a positive percentage, shows strength.
For hundreds of ETF choices, be sure to reference Thursday’s StatSheet.
Year to date, here’s how our candidates have fared so far:
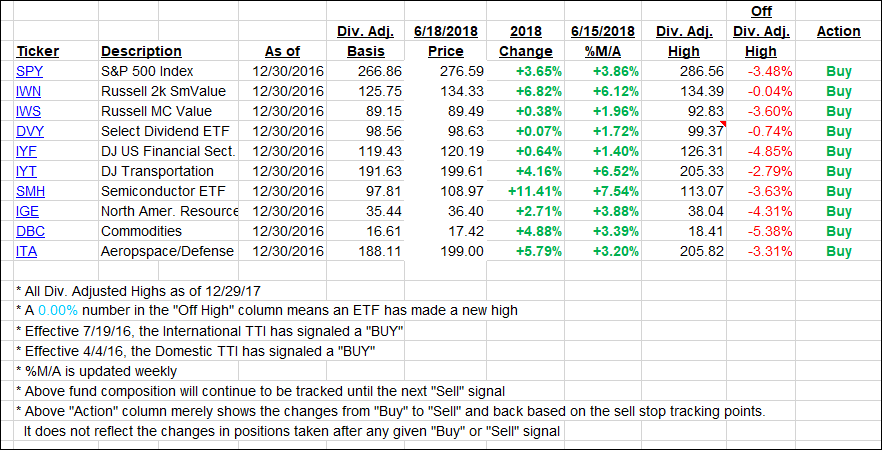
Again, the %M/A column above shows the position of the various ETFs in relation to their respective long-term trend lines, while the trailing sell stops are being tracked in the “Off High” column. The “Action” column will signal a “Sell” once the -7.5% point has been taken out in the “Off High” column.
- Trend Tracking Indexes (TTIs)
Our Trend Tracking Indexes (TTIs) were mixed with the International one once again taking a steep drop while the Domestic one gained a tad.
Here’s how we closed 06/18/2018:
Domestic TTI: +2.85% above its M/A (last close +2.83%)—Buy signal effective 4/4/2016
International TTI: +0.82% below its M/A (last close +1.26%)—Buy signal effective 7/19/2016
Disclosure: I am obliged to inform you that I, as well as my advisory clients, own some of the ETFs listed in the above table. Furthermore, they do not represent a specific investment recommendation for you, they merely show which ETFs from the universe I track are falling within the guidelines specified.
Contact Ulli