
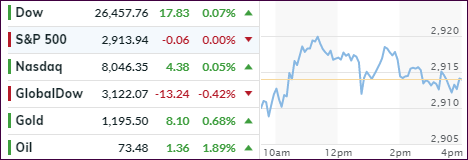
[Chart courtesy of MarketWatch.com]
- Moving the markets
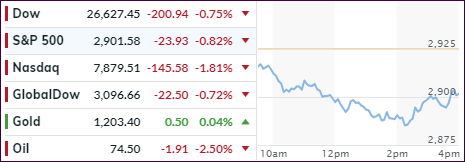
The was no question as to what the driver was to pull the markets down in no uncertain terms. As I cautioned just yesterday, surging bond yields will affect markets eventually, and that moment arrived today as the 10-year yield catapulted towards the 3.23% level, but it eventually settled at 3.19% up 3 basis points from yesterday’s close.
The major indexes slumped with the Dow at one point being down 357 points, or 1.3%, but buying set in and some of the mid-day losses were reversed. Nevertheless, red was the color of the day with the Nasdaq experiencing the brunt of the sell-off with -1.81%.
The spike in bond yields may not be over and “stock markets are entering the danger zone,” according to Bloomberg. What that means is that stocks can only handle yields rising to a certain point before being adversely affected. No one knows where that level is, but I think we’ll be soon finding out that moment of truth should bond yields rise further.
With the Nasdaq slumping the most, it comes as no surprise that the FANG stocks were hammered—not just today, but since the beginning of the month. Semiconductors followed suit with SMH dropping -2.25% and closing below its 5-month uptrend line. In the meantime, the US Dollar did a dump-and-pump and closed higher on the day.
Again, bond investors saw the widely held TLT lose another -0.71% and not just making a new low for 2018 but also increasing the YTD loss to -9.48%. Ouch!