
- Moving the markets
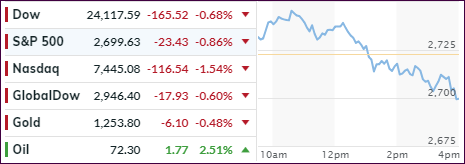
Follow through momentum from yesterday’s modest rebound ran into a brick wall mid-day, the bears took over and down we went with the major indexes diving decisively into the red and closing at the lowest level of June.
It sure looked like an early dead-cat bounce died suddenly and selling accelerated, as sentiment was influenced by the usual suspect, namely the ever-present anxiety over trade policy.
Only 3 of the primary S&P sectors ended on the plus side, while tech dropped -1.5%, which was followed by consumer discretionaries with -1.3%. The financial sector (-1.3%) set a new dubious record by extending the number of its successive daily declines to 13.
The Dow continued to bounce around its 200-day M/A but closed below it for the 3rd day as the VIX headed higher to top the 18 level. The massacre in Emerging Markets continued after a pausing for a few days, caused in part by a renewed surge in the US dollar with UUP gaining +0.60%.
Our International TTI slipped again and is confirming that the bears have won the battle for the time being. This indicator is now sitting -2.07% below its long-term trend line and therefore in bear market territory. As posted, I already liquidated some of our “broadly diversified international equity ETFs” and will sell the remaining balance tomorrow.
Again, I will watch the market action early on and, should there be a huge rebound in the making, I will hold off taking any action. Otherwise, the effective date for this international “Sell” signal will be 6/28/2018.
- ETFs in the Spotlight
In case you missed the announcement and description of this section, you can read it here again.
It features 10 broadly diversified and sector ETFs from my HighVolume list as posted every Saturday. Furthermore, they are screened for the lowest MaxDD% number meaning they have been showing better resistance to temporary sell offs than all others over the past year.
The below table simply demonstrates the magnitude with which some of the ETFs are fluctuating regarding their positions above or below their respective individual trend lines (%M/A). A break below, represented by a negative number, shows weakness, while a break above, represented by a positive percentage, shows strength.
For hundreds of ETF choices, be sure to reference Thursday’s StatSheet.
Year to date, here’s how our candidates have fared so far:
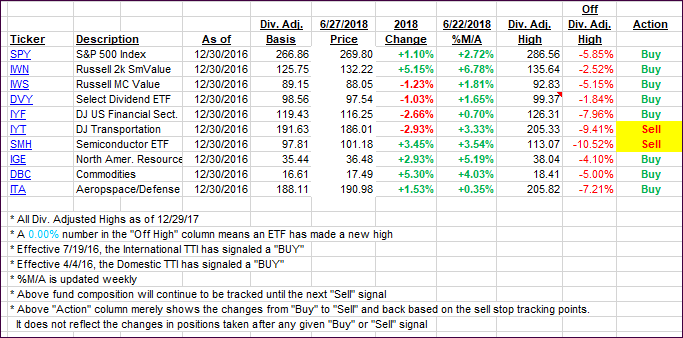
Again, the %M/A column above shows the position of the various ETFs in relation to their respective long-term trend lines, while the trailing sell stops are being tracked in the “Off High” column. The “Action” column will signal a “Sell” once the -7.5% point has been taken out in the “Off High” column.
- Trend Tracking Indexes (TTIs)
Our Trend Tracking Indexes (TTIs) headed south as an early rally died at end of the session.
Here’s how we closed 06/27/2018:
Domestic TTI: +1.28% above its M/A (last close +1.74%)—Buy signal effective 4/4/2016
International TTI: -2.07% below its M/A (last close -1.35%)—Buy signal effective 7/19/2016
Disclosure: I am obliged to inform you that I, as well as my advisory clients, own some of the ETFs listed in the above table. Furthermore, they do not represent a specific investment recommendation for you, they merely show which ETFs from the universe I track are falling within the guidelines specified.
Contact Ulli