
- Moving the markets
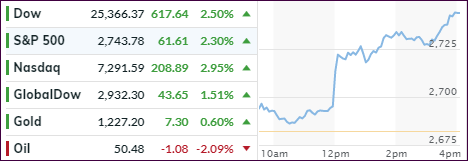
Today, only one topic mattered and that was what Fed chief had to say about interest rates. His comment that they are “just below where they won’t stimulate the economy” was enough to get the buying spree going with the major indexes scoring solidly, as the chart above shows.
The Wall Street crowd interpreted this not only as a softening tone (dovish) regarding future rate hikes but also that we may be close to the “neutral” rate, a level where its alleged effect on economic growth would be neither positive nor negative. These words appear to be a turnaround from comments made in October, when Powell opined that the “central bank may go past neutral, but we’re a long way from neutral at this point, probably.”
That indeed appears to be a change of heart, still, Powell did not mention anything about the expected rate hike at their next meeting in December. Some analysts argued that Powell was not as dovish as was interpreted, as he did not mention any expectations for slower growth or weaker inflation.
In the end, the US Dollar dumped on Powell’s apparent flip flop, but caution is warranted, as one analyst noted:
“The markets are overreacting to what Powell said, perhaps partly because some of the newswire headlines don’t quite accurately convey the nuance of what he said…”
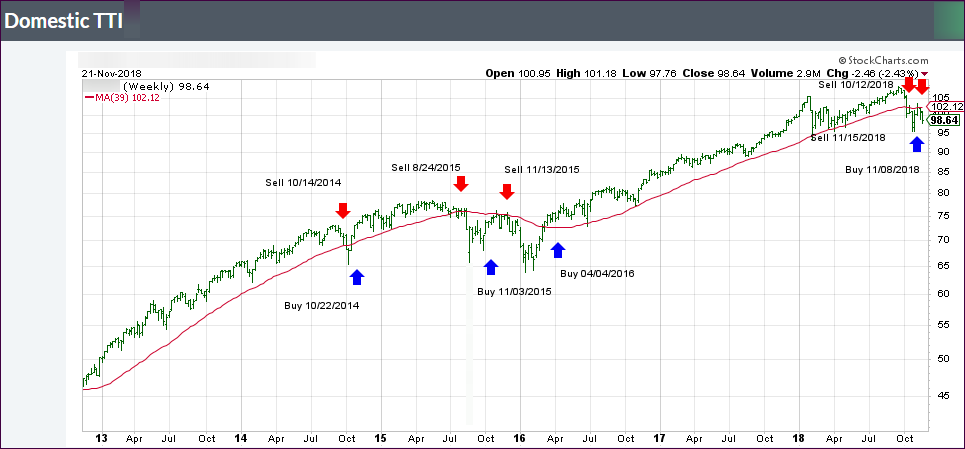
With today’s advance, the S&P has now wiped out its huge Thanksgiving week losses, but it’s too early to tell if this is just one big head fake, especially with China’s trade negotiations on deck in a few days. Again, if these turn out to be positive, our Domestic TTI (section 3) may very well be pushed to the bullish side of its trend line getting us back in the market.