
- Moving the markets
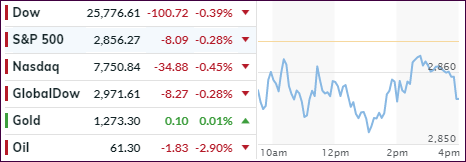
After yesterday’s strong rebound, the markets opened on a weak note with the major indexes spending the entire session below their respective unchanged lines trying to find some footing.
Not helping matters early on was a worsening of trade relations with China, which to me has now morphed into an all-out trade war, as a Chinese company has told all of its employees to boycott American products and halt international travels to the U.S. That kept the markets on a slippery footing until the Fed released its minutes on interest rates from its last meeting.
The Fed, as expected, revealed that their members are comfortable being “patient” on their current stance on interest rates, a position which could last “for some time.” While officials were split on the rate outlook over the long term, no one wanted to rock the boat “and push for a near term policy shift in either direction.”
In the end, the Fed’s announcement was not enough to keep the bears in check, and, after a mid-day rally, we dove into the close with selling picking up due to the White House ramping up its trade war rhetoric.
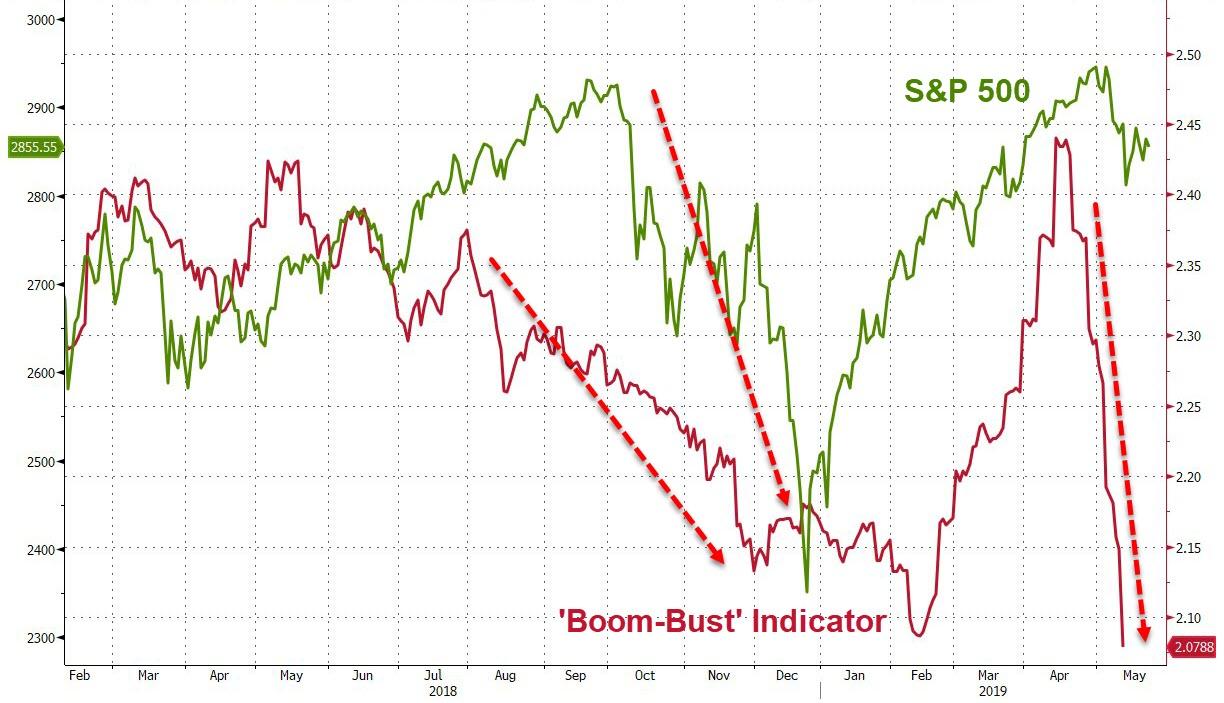
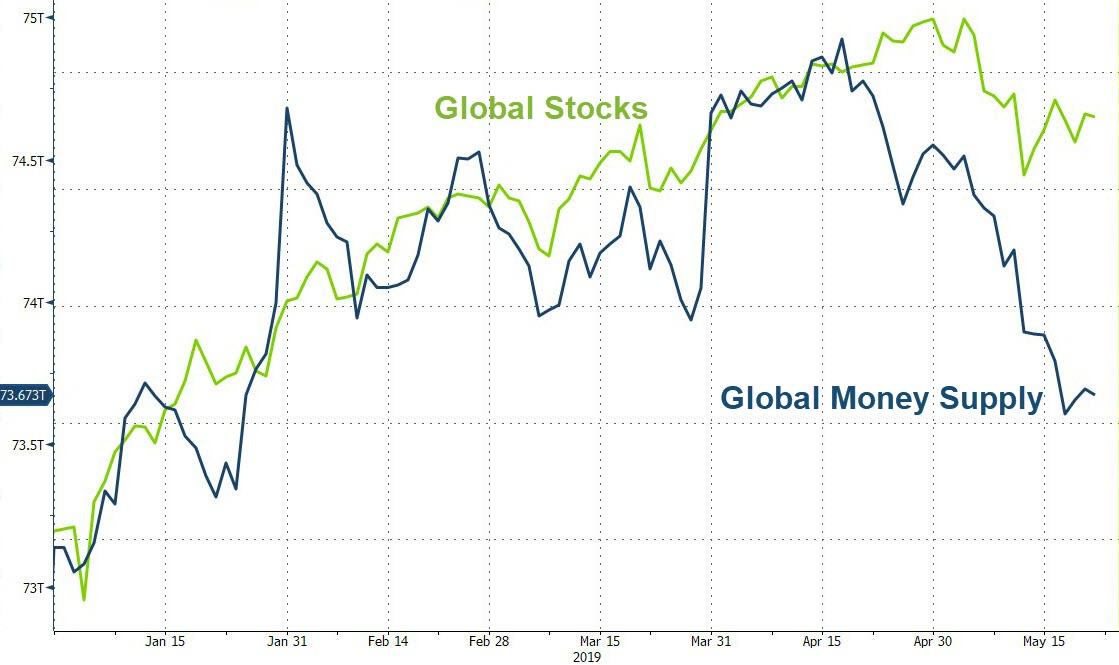
Where do we go from here? While our Trend Tracking Indexes (TTIs) continue to support the bullish theme, there are two indicators, which are flashing warning signs. The first one, thanks to Bloomberg, is a Boom-Bust indicator charted against the S&P 500, while the second one is the Global Money Supply Index.
Both are forecasting a potential decline in stocks, however, as always, the timing of it is the big unknown. For that, we will rely on our Trend Tracking Indexes (TTIs) to point the way towards the exit doors, once the need arises.
2. ETFs in the Spotlight
In case you missed the announcement and description of this section, you can read it here again.
It features 10 broadly diversified and sector ETFs from my HighVolume list as posted every Saturday. Furthermore, they are screened for the lowest MaxDD% number meaning they have been showing better resistance to temporary sell offs than all others over the past year.
The below table simply demonstrates the magnitude with which some of the ETFs are fluctuating regarding their positions above or below their respective individual trend lines (%+/-M/A). A break below, represented by a negative number, shows weakness, while a break above, represented by a positive percentage, shows strength.
For hundreds of ETF choices, be sure to reference Thursday’s StatSheet.
For this current domestic “Buy” cycle, here’s how some our candidates have fared:
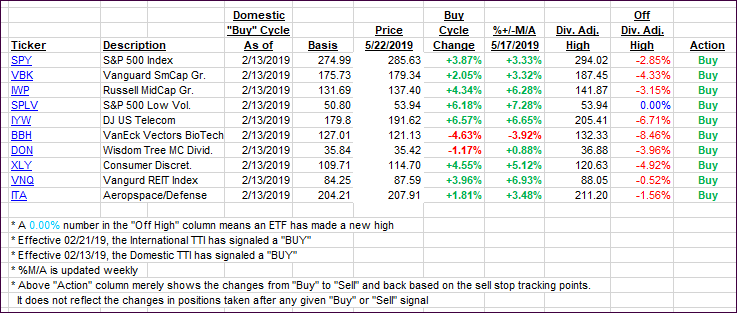
Again, the %+/-M/A column above shows the position of the various ETFs in relation to their respective long-term trend lines, while the trailing sell stops are being tracked in the “Off High” column. The “Action” column will signal a “Sell” once the -8% point has been taken out in the “Off High” column. For more volatile sector ETFs, the trigger point is -10%.
3. Trend Tracking Indexes (TTIs)
Our Trend Tracking Indexes (TTIs) pulled back but remain on the bullish side of their respective trend lines. However, the International one has demonstrated more weakness lately by hugging its trend line from both sides.
Here’s how we closed 05/22/2019:
Domestic TTI: +3.08% above its M/A (last close +3.61%)—Buy signal effective 02/13/2019
International TTI: +0.16% above its M/A (last close +0.44%)—Buy signal effective 02/21/2019
Disclosure: I am obliged to inform you that I, as well as my advisory clients, own some of the ETFs listed in the above table. Furthermore, they do not represent a specific investment recommendation for you, they merely show which ETFs from the universe I track are falling within the specified guidelines.
Contact Ulli