
- Moving the markets
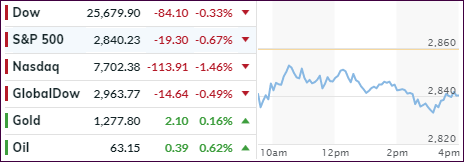
The trade war rhetoric between the U.S. and China heated up over the weekend, with both sides threatening a variety of consequences. The major indexes headed south with the Nasdaq taking the brunt of the losses.
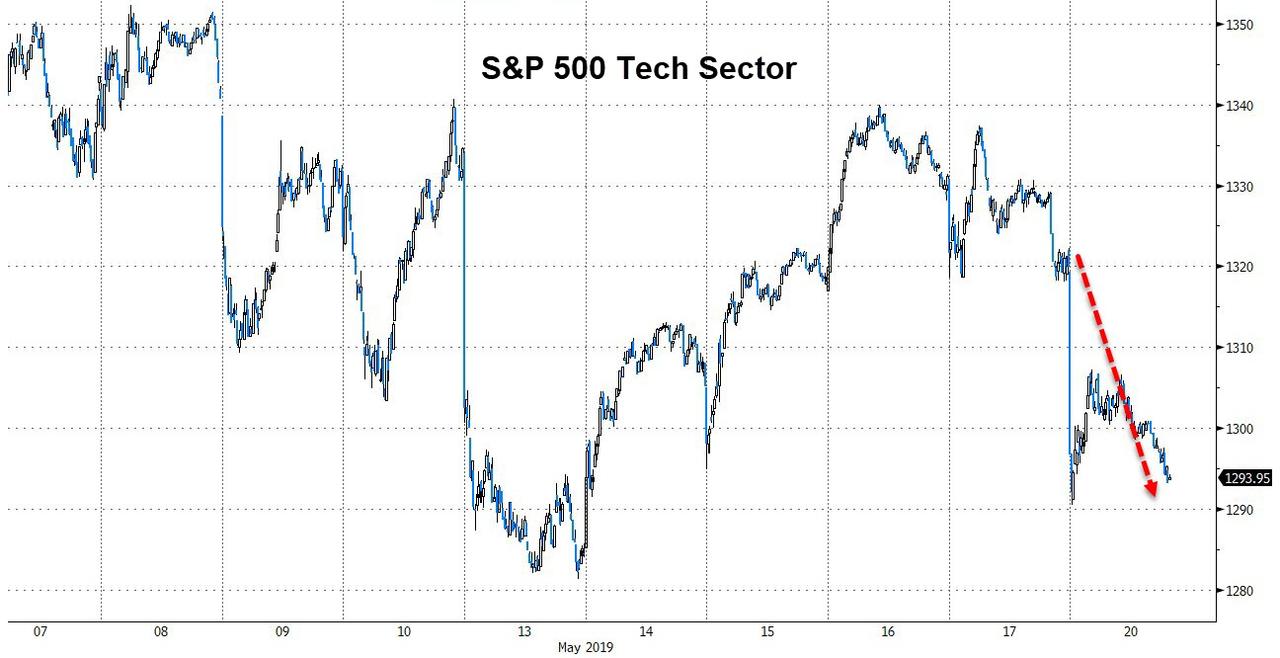
Chipmakers took it on the chin, as U.S. tech companies, in compliance with White House requests, have begun to implement the ban on Huawei Technology products. The company will be cut off from receiving Android updates and will be restricted to use only public open-source versions of the software program.
AAPL stock fell after warnings of retaliatory action from China, which plays a big role in how Chinese consumers perceive U.S. products, and “acceleration” to adopt local iPhone substitutes could be damaging to say the least.
To further put the heat on the U.S., China’s Xi threatened to use one of their nuclear options, namely banning Rare-Earth mineral exports, which for sure would cripple supply chains of these rare commodities necessary in all tech products and military applications.
In other words, the tit-for-tat continues with no end in sight, and it appears that trade differences are about to morph into an all-out trade war. That will not be a positive for equity markets, unless the bizarre theme of the past that “bad news is good news” still makes its presents felt.
2. ETFs in the Spotlight
In case you missed the announcement and description of this section, you can read it here again.
It features 10 broadly diversified and sector ETFs from my HighVolume list as posted every Saturday. Furthermore, they are screened for the lowest MaxDD% number meaning they have been showing better resistance to temporary sell offs than all others over the past year.
The below table simply demonstrates the magnitude with which some of the ETFs are fluctuating regarding their positions above or below their respective individual trend lines (%+/-M/A). A break below, represented by a negative number, shows weakness, while a break above, represented by a positive percentage, shows strength.
For hundreds of ETF choices, be sure to reference Thursday’s StatSheet.
For this current domestic “Buy” cycle, here’s how some our candidates have fared:
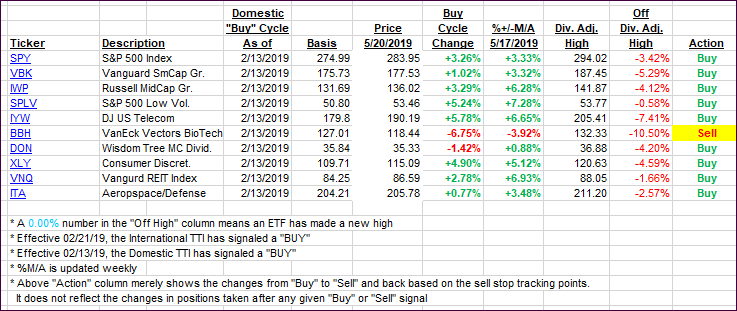
Again, the %+/-M/A column above shows the position of the various ETFs in relation to their respective long-term trend lines, while the trailing sell stops are being tracked in the “Off High” column. The “Action” column will signal a “Sell” once the -8% point has been taken out in the “Off High” column. For more volatile sector ETFs, the trigger point is -10%.
3. Trend Tracking Indexes (TTIs)
Our Trend Tracking Indexes (TTIs) headed south with the International one again slipping slightly below its long-term trend line. Here again, I will wait for further downside confirmation before declaring a ‘Sell’ signal.
Here’s how we closed 05/20/2019:
Domestic TTI: +2.50% above its M/A (last close +3.15%)—Buy signal effective 02/13/2019
International TTI: -0.11% below its M/A (last close +0.35%)—Buy signal effective 02/21/2019
Disclosure: I am obliged to inform you that I, as well as my advisory clients, own some of the ETFs listed in the above table. Furthermore, they do not represent a specific investment recommendation for you, they merely show which ETFs from the universe I track are falling within the specified guidelines.
Contact Ulli